

Introduction
The objective of UN-REDD is to create an infrastructure that helps in the transparent dissemination of forest change, by processing and publishing forest (remote sensing) data, validated and open for public feedback of people in the monitored areas.
This manual describes the dissemination system, its architecture, components and use.
System Overview
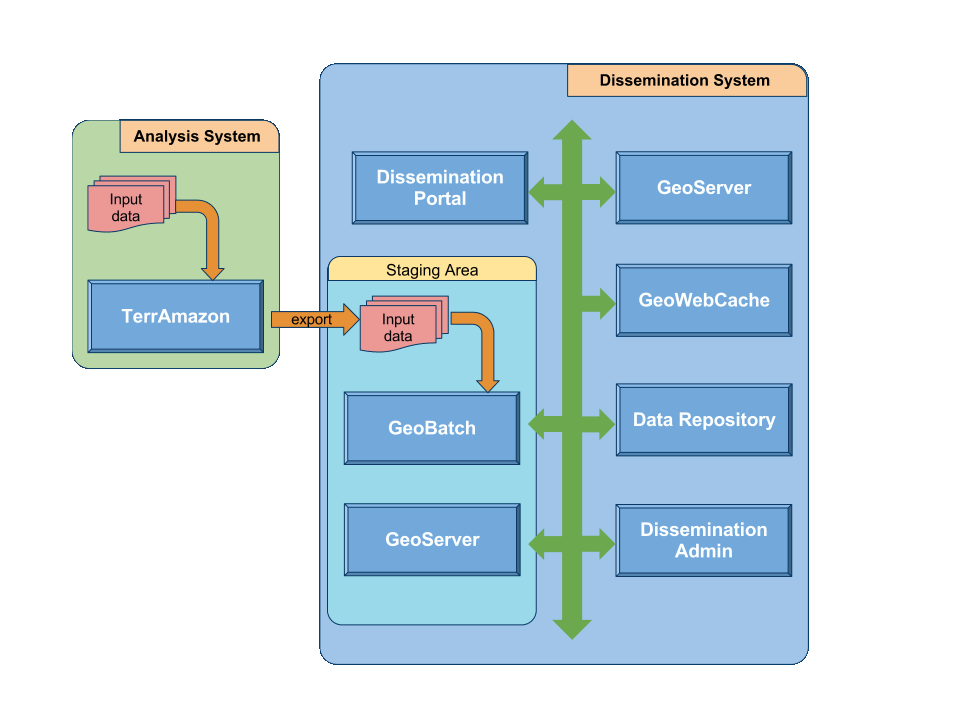
The whole system is composed of two main blocks: the analysis system and the dissemination system.
The analysis system includes:
- the source data mass import,
- the operator-assisted analysis part handled by the TerrAmazon application,
- the massive export of the preprocessed data in some agreed standard formats.
The dissemination system includes:
- ingestion of the data provided by the analysis system;
- data cataloguing;
- specific geographic data processing (optimization);
- statistics processing (both fixed statistics, and on-demand statistics);
- data publishing (services offering interfaces for data query and retrieval);
- the user front-end where data can be searched for, accessed and visualized by a human;
- the admin front-end where staging data can be published, and where published data can be edited/corrected.
System Overview
Use cases
User interface
- the user can choose one (or more) geographic layers to be shown on the map
- the user can choose the time dimension by selecting one single date for all the shown layers
- the user can choose another date, in addition to the one for all of the displayed layers, in order to be able to compare the changes on a thematic layer at different times;
- the user can visualize pre-computed statistics on a collection of pre-established polygons (v. gr. administrative boudaries).
- the user can request on the fly statistics on a polygon drawn on the screen.
- a user will be able to post geo-referenced comments and post warnings about wrong features. A data administrator will be able to review the comments and act accordingly.
Data ingestion
When the analysis subsystem exports a new batch of data, the dissemination subsystem will:
- reorganize the data according to a predefined schema
- preprocess geographic data in order to:
- precompute and store as much information as possible (e.g. pre-computed statistics) for better performance and scaling
- preprocess data in order to improve visualization performance
- update internal metadata about time series
- publish the new geographic layers in the staging area (or add new time coordinates to the time series)
- generate a tile cache for tile oriented visualization (e.g. google maps client)
Admin interface
Administrators are able to:
- Receive user comments and warnings about publised data.
- Edit the features of vector layers:
- Once a vector layer has been modified and republished, all of its related precomputed stats should be recomputed again.
- Publish layers waiting in the staging area.
- The administrator will see a list of the new data that has been submitted into the staging area by the analysis system. New data will be a new time coordinate related to an existing layer in the dissemination system.
- The administrator will be allowed to:
- view the new data,
- edit the features (if needed),
- publish the new data into the dissemination system.
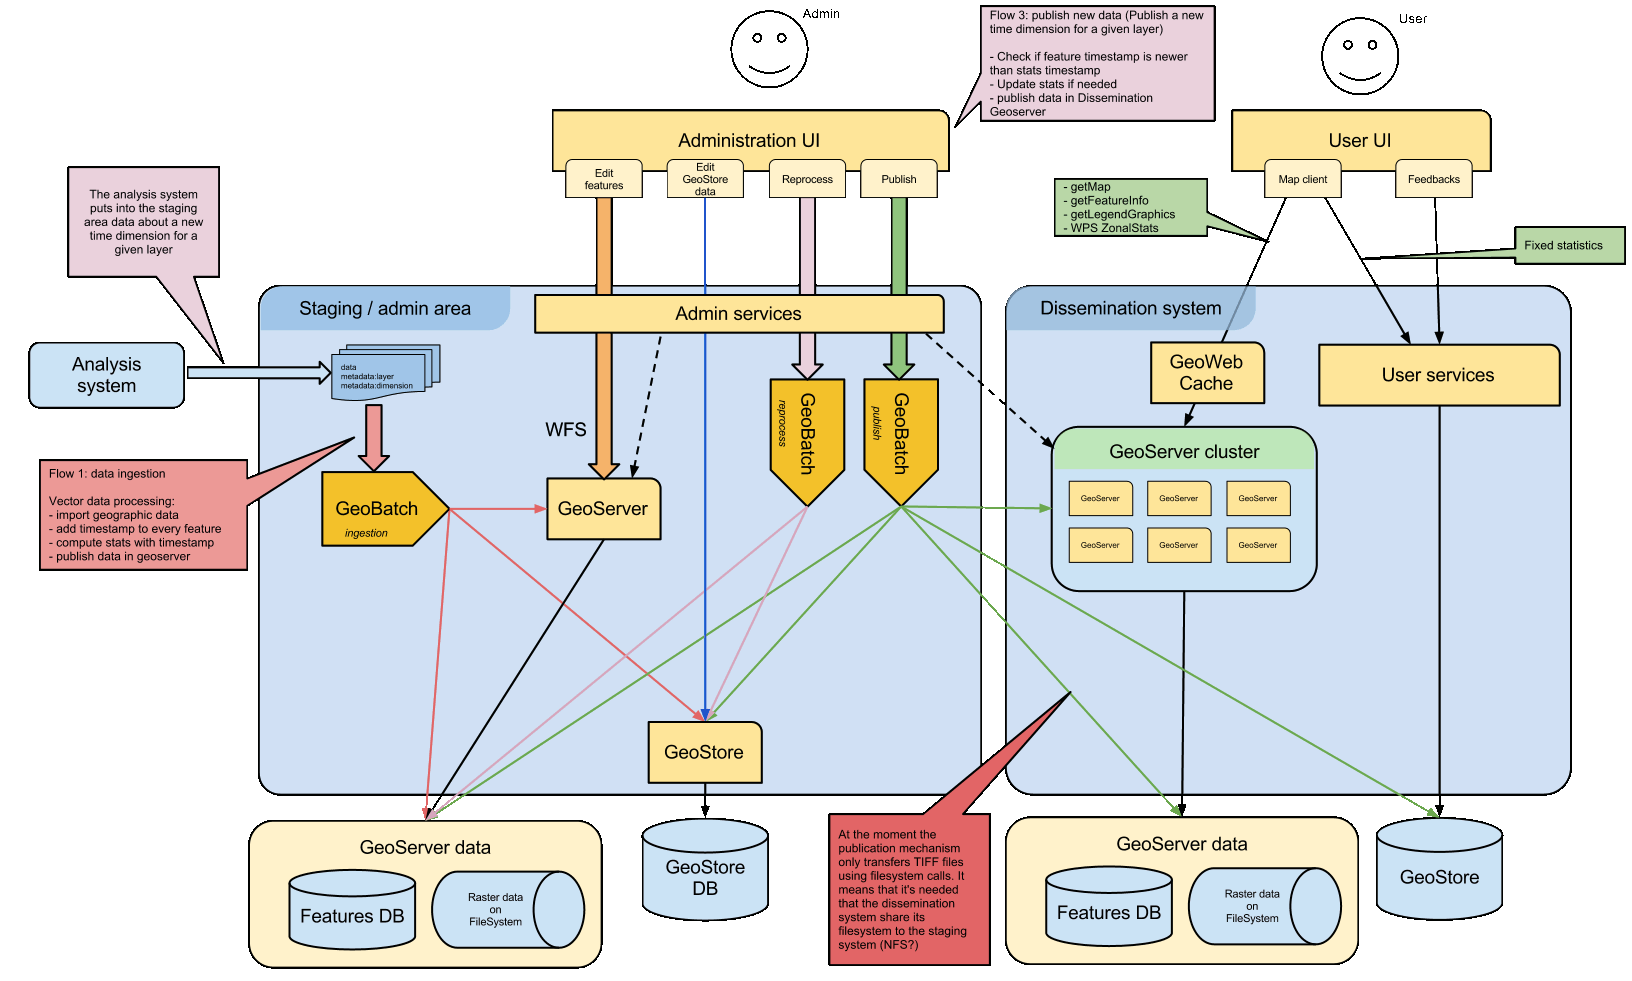
System Architecture
The dissemination subsystem can be split into several blocks:
- raw data ingestion and pre-processing (GeoBatch)
- internal data storage (GeoStore)
- geographic data publishing (GeoServer)
- statistics publishing (WPS)
- user front-end (Portal interface)
- management of the data flows (Admin interface)
System Architecture
Data Ingestion with GeoBatch
GeoBatch is a geospatial aware batch processing system to ease the processing, the deploy, and the management of jobs on streams of geospatial data.
When the analysis subsystem exports its data, GeoBatch will start to process such data, by running site specific scripts that would end in the publication of the geographic data in GeoServer, but that would also perform all the preprocessing steps identified above, like as an instance upfront computation of statistics for predefined areas.
Geographic Data Publishing with GeoServer
GeoServer is an open source software server that allows the publishing of geospatial data from any major spatial data source using open standards from OGC and ISO.
Geographic Data Caching with GeoWebCache
GeoWebCache is a web application used to cache map tiles coming from a variety of sources such as OGC Web Map Service (WMS).
It is used to improve the GeoServer workload for WMS service.
Dynamic statistics with WPS
The Web Processing Service is an OGC specification that defines a standard interface that facilitates the publishing of geospatial processes. GeoServer already provides a WPS implementation.
Dynamic statistics are implemented via WPS, in order to exploit some existing procedures, by using a standard interface that can be easily implemented for the required processing. A first implementation is the ZonalStats process, a process that computes various statistics on given layers, being them raster or vector, in a given set of polygons.
On-the-fly processing, however implemented, is usually a very resource-intensive process, and this applies to WPS as well. This problem can be partially mitigated by having a cluster of GeoServer instances, and pre-computing the predefined area statistics at publication time.
Non-geographic data publishing
A flexible data repository is needed to store various pieces of information, be them static or fixed. These data may be created either by the server, or input by the user. Some examples are static statistics, as well as (possibly geo-referenced) comments and notes posted by users.
The Data Repository is accessed via a RESTful front end.