

Portal: Adding Ingested Layer and Statistics Charts
Finally, we are going to add to the Portal the newly ingested “forest_mask” layer, make the “regions” layer queryable, and link the statistics charts to it.
Adding the Forest Mask layer
Again, we are adding a “layer” and a “context” to the layers.json. We
already learned how to do it, so just paste the following elements to the file.
- Add the following layer definition:
{
   "id": "forestMask",
   "baseUrl": "/diss_geoserver/wms",
   "wmsName": "unredd:forest_mask",
   "wmsTime": "${time.forest_mask}",
   "imageFormat": "image/png8",
   "visible": true,
   "legend": "forest_mask.png"
}
Note that the “wmsTime” element, instead of listing a collection of timestamps, is using a special syntax: “${time.forest_mask}”. In this way we indicate to the Portal application that the timestamps should be retrieved from GeoBatch’s LayerUpdates. So when a new LayerUpdate is ingested, the time stamps are automatically updated.
- Add the following context definition:
{
   "id": "forestMask",
   "active": false,
   "label": "${forest_mask}",
   "layers": ["forestMask"]
}
This is a normal context definitions, similar as the others we have seen during the workshop.
Finally, add the context to the same layer group where Forest Cover is. It should look like:
{
  "group": {
    "label": "${forest_area_and_forest_area_change}",
    "items": [
      { "context": "forestCover" },
      { "context": "forestMask" }
    ]
  }
}
Making Regions queryable
To make regions queryable, we will use an auxiliary regions layer called “regions_simp”. It is the same as the “regions” layer, but the geometries have been simplified, so they can be loaded in the the Portal even in poorly performant web browsers.
The trick is to add “regions_simp” as an “invisible” layer and use it only as the query target.
Add this new layer element to layers.json:
{
  "id": "regionsSimp",
  "baseUrl": "/diss_geoserver/wms",
  "wmsName": "unredd:regions_simp",
  "imageFormat": "image/png",
  "visible": false,
  "queryable": true
}
Note that the “visible” attribute is set to false, so it won’t be shown into the map, but the new “queryable” attribute is set to true, so this is the layer that will be used when clicking over the layer to get its related information.
Search for the “regions” context, and edit the “layers” attribute so it includes both “regions” and “regionsSimp” layers:
"layers": ["regions", "regionsSimp"]
In this way, when the regions layer is visible, a click on the map will trigger a query over the “regionsSimp” layer.
Linking to the Statistics charts
Before testing the new changes in the portal, we need to add a custom javascript function in “custom.js” which contains the actions to be taken when a query response arrives from the server.
Open the
static/custom.jsfile, and add the following code into theUNREDD.layerInfoobject:regions_simp: function (feature) { var that = {}; that.title = function() { return messages.province + ": " + feature.attributes.NAME1; }; that.statsLink = function() { return UNREDD.wmsServers[0] + '/stg_geostore/rest/misc/category/name/ChartData/resource/name/deforestation_script_' + feature.attributes.ID + '_' + languageCode + '/data?name=' + feature.attributes.NAME1; }; return that; }
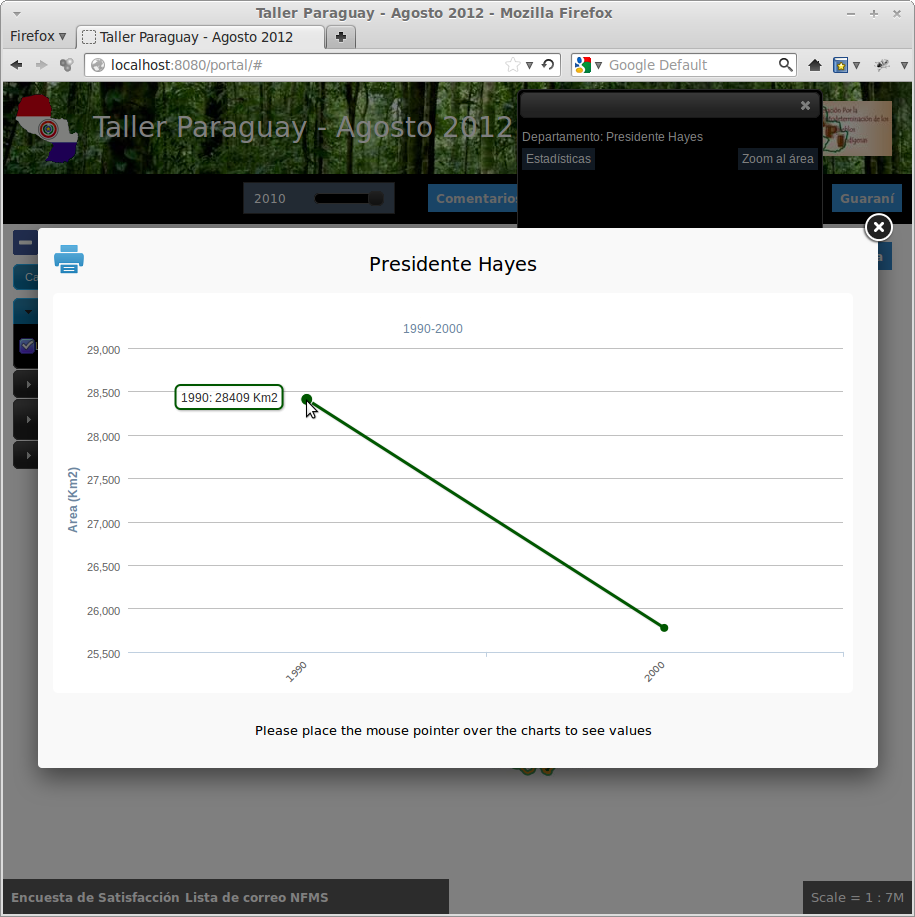
Reload the Portal page, click over a Department, and click on the “statistics” link. You should see:
Publishing a layer update chart
To publish the chart and make it available on the portal:
- Open the administration interface (http://localhost/admin) and login (admin/Unr3dd)
- Click on the [layer updates] link related to the forest_mask layer
- Click on the [republish] link related to the year you want to publish
As an exercise:
- Ingest, calculate statistics and render deforestation charts for the years 2005, 2010.