

Interface description
The UNREDD NFMS portal relies on GeoStore and GeoBatch to process data coming from the analysis tool, publish them on GeoServer and to produce statistics and charts.
The UNREDD GeoStore Administration User Interface allows the administrator user of the UNREDD NFMS portal to easily configure and manage the publication and processing flows by creating and editing the following GeoStore resource types:
- Layers
- Stats defs
- Chart scripts
In addition it allows to show the data that are automatically ingested by the ingestion flow as new data (time instance for a given layer) arrives, and data produced by the processing flow:
- Layer updates (ingestion flow)
- Stats data (processing flow)
- Chart data (processing flow)
Finally, it allows the administrator to launch the processing flow when spatial data, or the statistics definition xml, or a Groovy script are modified.
In the following chapters we’ll see in detail how the administrator user can manage the web portal.
Layers
Layer list
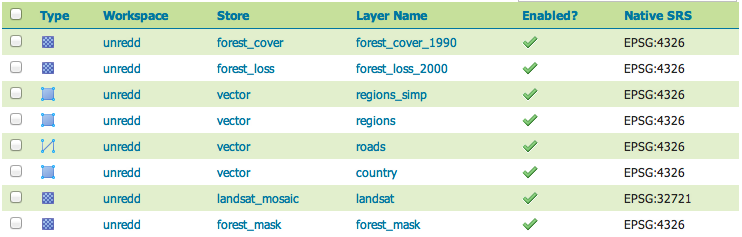
In the Layers page you can view and manage the list of all the layers managed by GeoStore/GeoBatch. For each of the layers the following operation are available:
- sho Layer attributes (
[show]links in the image below) - edit the Layer attributes (
[edit]links in the image below) - delete the layer (
[delete]links in the image below) - view layer updates related to the layer (
[layer updates]links in the image below)
You can also add a new raster or vector layer record using the [vector] and [raster] buttons.
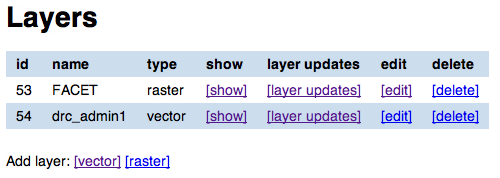
Layer List
Show layer attributes
To show the attributes of a layer record click on the [show] link next to its name. As the raster and vector layers have different sets of attributes, the visualization page differs depending on the one you choose (see the Show raster layer and Show vector layer images below).
From the Layer show page you can
- access to the list of Layer Updates (
[Layer Updates]link) - view the list of Stats Defs related to this layer (
[Stats Defs]link) - access the show pages for the single Stats Defs
Show raster layers attributes
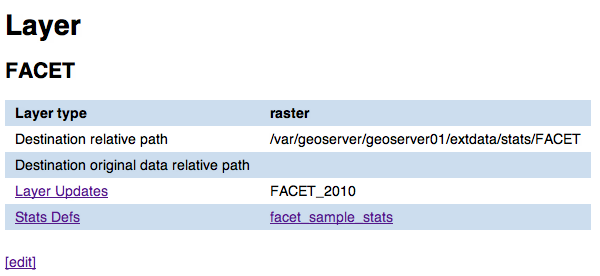
Show raster layer
In this page you can view all the attributes for a given raster layer. For attribute definition please refer to Raster layer add/edit form.
Show vector layers attributes
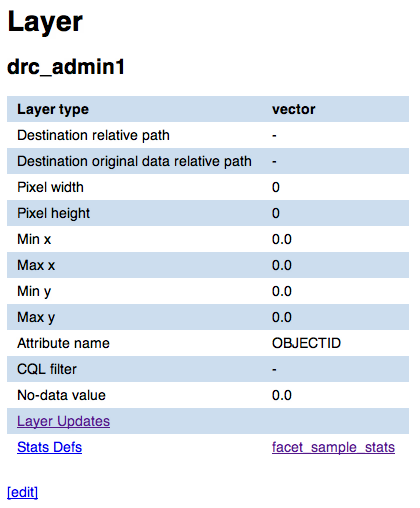
Show vector layer
In this page you can view attributes and data for a given vector layer. For attribute definition please refer to Vector layer add/edit form.
Edit layer attributes
Raster layer add/edit form
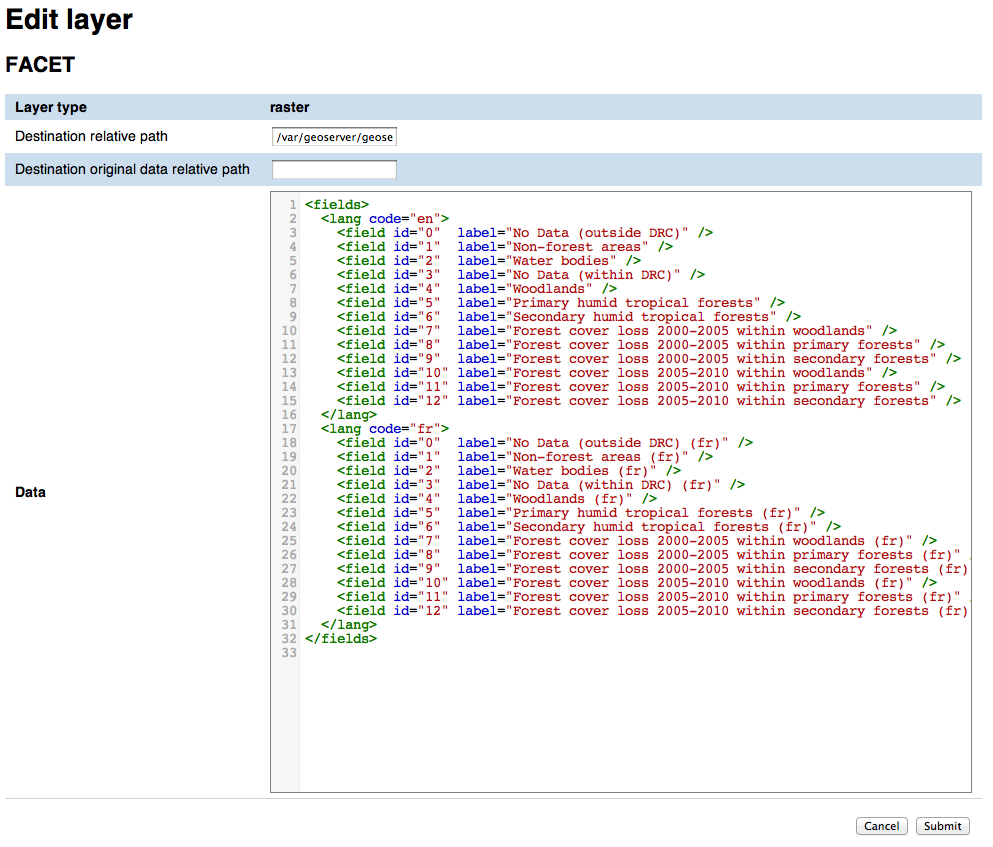
Raster layer edit form
In the raster layer edit form you can enter the following attributes for a raster layer:
- type
- This is actually not editable as it’s automatically filled when you click on the add
[raster]or[vector]layer links in the Layer list page - Dissemination mosaic path
- Full path of directory where the geotiff has to be copied in the Dissemination System, in the Publish flow. This field may be not used in sites where the dissemination system and the stagin area share the same filesystem
- Data destination path
- Full path where the original data has to be moved in
- URL
- URL to download the data
- Data
- Language data related to a the layer attribute. This data will be used by the scripts that create the statistics page from the stats data (see Chart script list). There’s no specification at the moment for the data format as it’s up to the Groovy script to parse it in order to create the localized charts
Once done with the editing you can click on the Submit button to save the changes, or you can click Cancel at any moment to cancel the editing.
Vector layer add/edit form
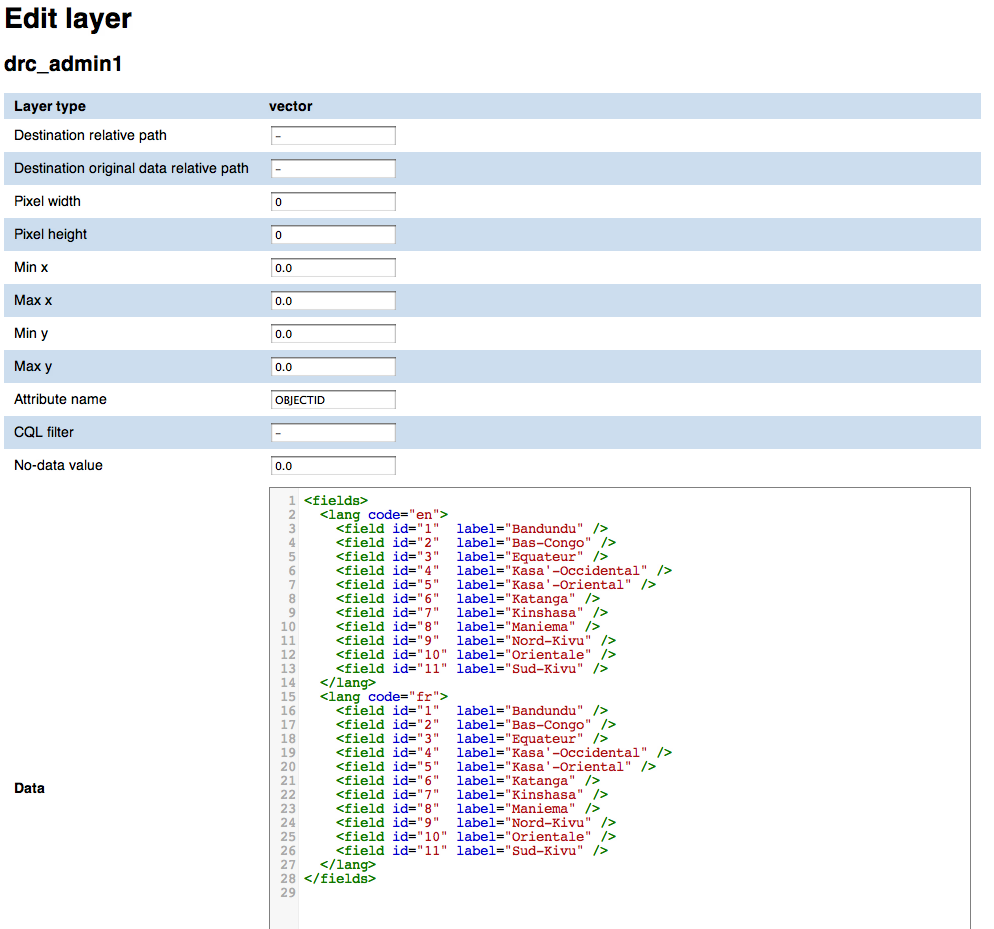
Vector layer edit form
In addition to the raster layer fields, vector layers have the following ones:
- Raster width
- Needed for rasterization
- Raster height
- Needed for rasterization
- Min x
- Minimum x coordinate in EPSG:4326 coordinate reference system
- Max x
- Maximum x coordinate in EPSG:4326 coordinate reference system
- Min y
- Minimum y coordinate in EPSG:4326 coordinate reference system
- Max y
- Maximum y coordinate in EPSG:4326 coordinate reference system
- Attribute name
- Name of the numeric feature attribute to set in the raster
- CQL filter
- (optional) CQL filter used to filter the features to be reported on the raster
- No-data value
- No-data value for the raster
- Data type
- Data type for output raster It’s one of the GDAL-recognized data types (Byte, Int16, UInt16, Int32, UInt32, Float32, Float64, CInt16, CInt32, CFloat32, CFloat64)
Delete a layer
To delete a layer click on the [delete] link in the layer list and click Ok on the confirmation dialog. All the layer updates for the layer are automatically deleted.
Layer updates
Layer updates represent time instance for a given layer
Ingest a new time instance for the layer
We are now going to see how to ingest a new LayerUpdate.
We will manually simulate the behavior of the analysis software
by copying the zip files containing the spatial data and XML definition
into the GeoBatch ingest directory, thus triggering the GeoBatch ingestion flow.
But before we go on with the ingestion flow, let’s have a look to how the zip
files are built internally: it must contain an XML file info.xml, and a directory
data.
The directory
datacontains the geodata to be published in the dissemination system, and to be used to compute statistics.The content of the file
info.xmlis:<?xml version="1.0" encoding="UTF-8"?> <info> <layername>forest_mask</layername> <format>raster</format> <year>2012</year> <month>08</month> <day>15</day> </info>
where
<layername>is the name of the layer this update should be appended to<format>may be raster or vector<year>is a mandatory element in a 4 digit format representing the year this update should be referenced to<month>is a optional element in a 2 digit representing the month this update should be referenced to (ranging from 01 to 12)<month>is a optional element in a 2 digit representing the month this update should be referenced to
To start the ingestion, generate a zip file with the described contents, and copy it into /var/geobatch/input/ingestion/.
You can view the status of the ingestion flow on the GeoBatch admin interface:
- Browse to geobatch main page.
- Click on Manage flows
- Insert user name and password and click Submit
- Click on IngestionFlow
- Click on Instances
You should see one instance running or completed:
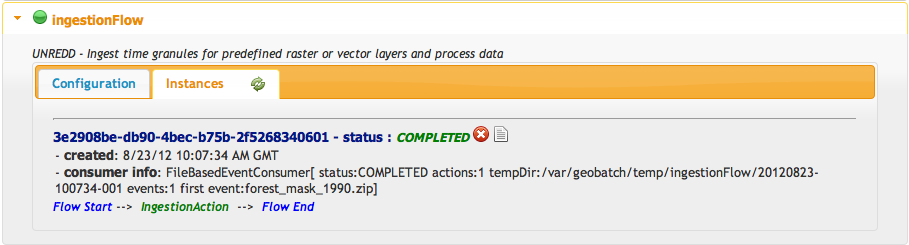
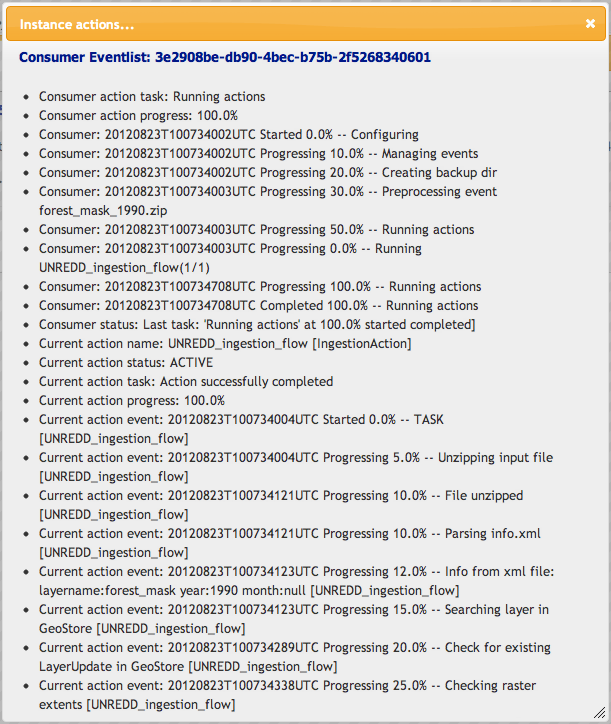
You can also view the log for the ingestion you just did by clicking on the instance logs icon.
You can also check that the store and layer have been created on GeoServer by GeoBatch:
Browse to the geoserver main page.
Insert user name and password and click Submit
Click on Stores
Check that the new store is there (same name as Layer in GeoBatch)
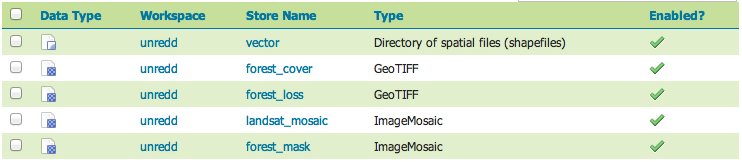
Click on Layers
Check that the layer is there
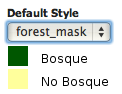
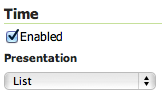
For the first layer update, the default style and the time dependency for the layer has to be set in GeoServer.
Click on Layers
Click on layer name
Click on the Publishing tab
Under the Default style menu choose the desired style.
Click on the Dimension tab
Check the Enabled checkbox
Under the Presentation menu choose List
Layer update list
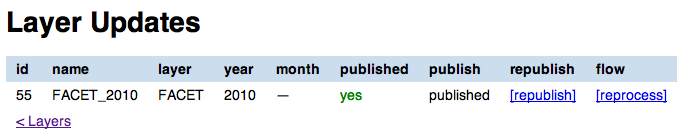
Layer update list
The layer updates page shows all the layer updates available for a given layer. For each layer update you can:
- publish the layer update
- republish the layer update if the layer has been modified. The new version of the file, together with the statistics produced by the reprocess flow, are then moved to the dissemination system
- start the reprocess flow to recalculate statistics and produce the charts for the layer update.
Publish a layer update
To publish a layer update, click on the [publish] button in the layer update list. When you publish a layer update the following operations are performed by GeoBatch:
- the layer update (time instance for the layer) is published on the dissemination GeoServer
- the related chart data are moved from the staging GeoStore server to the dissemination one
Reprocess a layer update
When the administrator changes some of the layer updates by editing them in the administration interface (for example after some user’s feedback in the dissemination tool) you can manually start the GeoBatch reprocess flow and start the processing chain. More in detail the following operations are performed by GeoBatch when clicking on the [reprocess] button:
- if it’s a layer update related to a vector layer, it gets rasterized
- all the stats data linked to the layer which the layer update belongs to are recalculated
- all the chart data (charts and tables) are re-rendered using the recalculated stats data
Republish a layer update
If the layer update has already been published and you modified either the layer update raster/vector file or the charts by running the reprocessing flow (see Reprocess a layer update), you can republish it and the operations described in Publish a layer update are performed with the new data.
Stats defs
Stats defs records define the statistics to be calculated from a set of layers. As data, they contain the XML definition that is used by the statistics calculation process to produce the CSV data that will be stored in stats data records
Stats def list
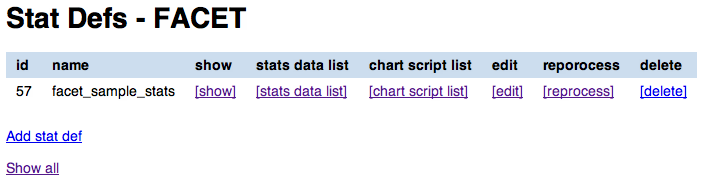
Stats def list
The stats defs list page shows the Stats defs linked to a given layer, or alternatively all the stats defs available in GeoStore. In the stats defs list page you can:
- show all the attributes for a given stats def (
[show]link) - view all the stats data produced by a given stats def (
[stats data list]link) - view the list of chart scripts depending on a given stats def (
[chart script list]link) - edit the stats def (
[edit]link) - run the reprocess flow (
[reprocess]link) - delete the stats def flow (
[delete]link) - view all the stats defs available in GeoStores (
Show alllink)
You can also add a new stats def by clicking on the Add stats def list, that opens the stats def edit form
Show stats def attributes
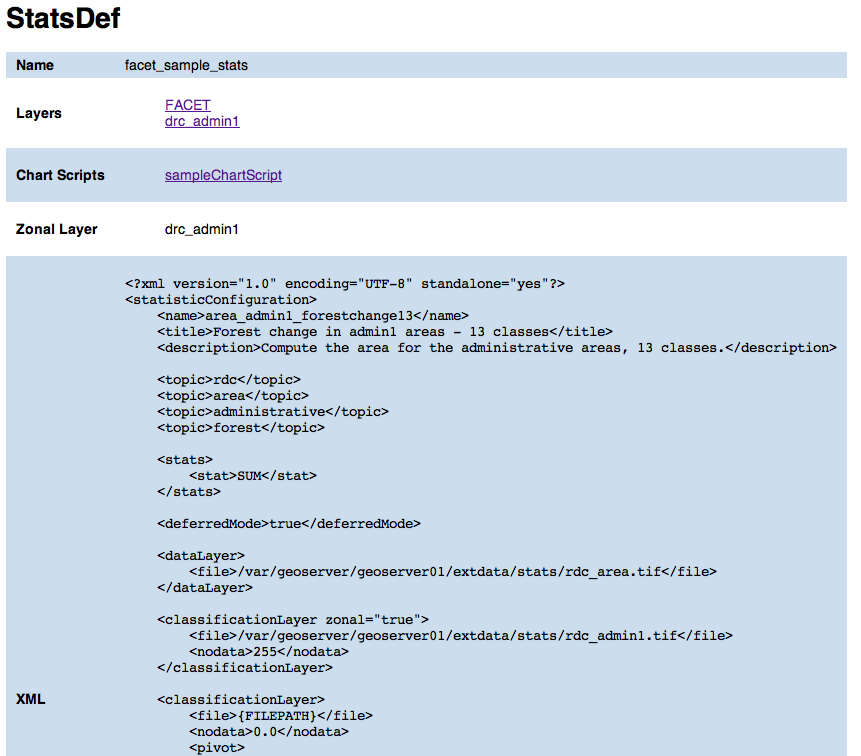
Stats def show
In this page you can view attributes and data for a given stats def record. For attribute definition please refer to Stats def edit/add form.
The page also contains links to the layers the stats def refers to and to chart scripts that depend on it.
Stats def edit/add form
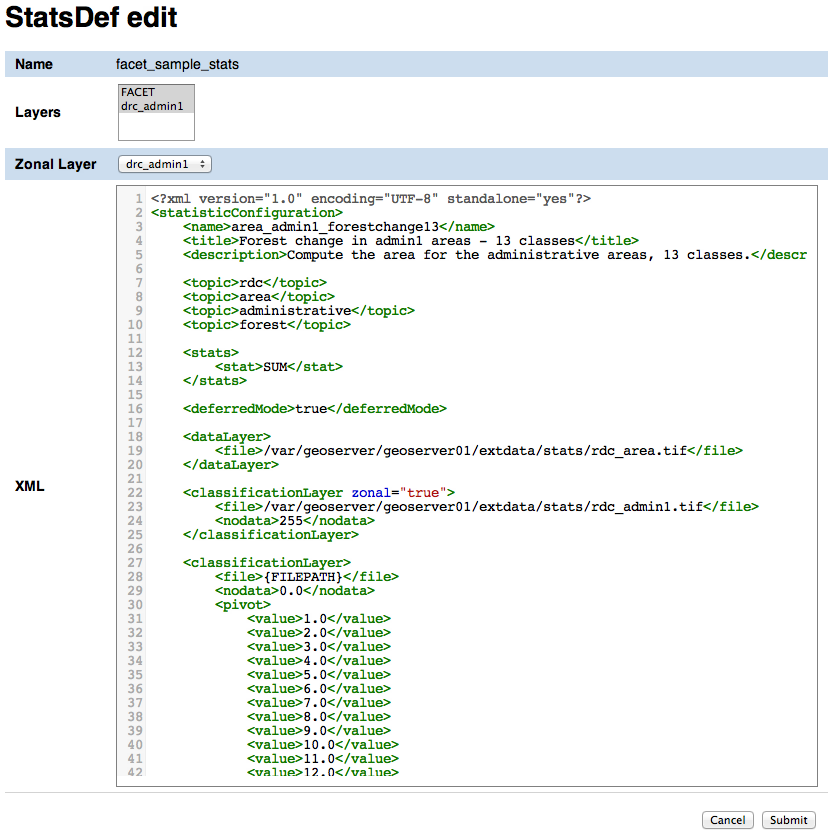
Stats def edit form
In the stats def edit/add form you can enter the following attributes:
- Name
- The name of the stats def (only editable if adding a new stats def, not when editing an existing one)
- Layers
- The layers this stats def depends on
- Zonal layer
- The zonal layer, as defined in the XML stats definition
- XML
- The XML configuration for the statistics calculation process
Once done with the editing you can click on the Submit button to save the changes, or you can click Cancel at any moment to cancel the editing.
Reprocess a stats def
When a stats def record is edited it’s necessary to run the reprocess flow to calculate the statistics and produce the new charts with the new definition for the statistics. The reprocess flow is run manually by clicking the [reprocess] link. The folling operations are performed
- the stats calculation procedure is run to recalculate the stats data
- all the chart data (charts and tables) are re-rendered using the recalculated stats data
Delete a stats def
To delete a stats def click on its [delete] link in the stats def list and click Ok to the confirmation dialog. All the related stats data are automatically deleted.
Stats data list
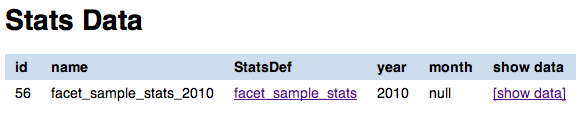
Stats data list
The stats data page shows all the stats data available for a given stats def. For each stats data you can:
- view its record attributes:
- name
- related stats def
- year
- month (optional)
- go back to the related stats def show page
- view the actual data (
[show data]link)
Chart scripts
Chart scripts records basically contain the absolute path to a Groovy script that will produce charts and tables from the CSV produced by the stats defs and stored in stats data records. It also contains references to the stats defs it depends to.
External files needed for chartscript execution
The chart script execution needs three files:
deforestation_stats.groovy, the main groovy script to build the chart. An example:
import groovy.text.SimpleTemplateEngine
import java.util.Map
import org.slf4j.Logger;
import org.slf4j.LoggerFactory;
import org.apache.commons.io.IOUtils
import it.geosolutions.unredd.geostore.model.UNREDDStatsData
import it.geosolutions.unredd.geostore.model.UNREDDChartData
import it.geosolutions.unredd.geostore.UNREDDGeostoreManager
import it.geosolutions.geostore.services.rest.model.RESTResource
import it.geosolutions.geostore.services.rest.GeoStoreClient
import it.geosolutions.geostore.services.rest.model.RESTStoredData
import it.geosolutions.geostore.core.model.Resource
import it.geosolutions.geostore.core.model.Attribute

log = LoggerFactory.getLogger("deforestation_stats.groovy");

println "_TEST_"
log.info "_TEST_"

htmlTemplateFilePath = '/home/unredd/Desktop/pry_workshop_data/groovy_script/deforestation_chart_template.html' // DEBUG
langFilePath         = '/home/unredd/Desktop/pry_workshop_data/groovy_script/lang.csv'

csvSeparator = ';'

// The following lines are used to test the script
// Comment out them for deploying with GeoBatch
class Conf {
    def geostore_url
    def geostore_username
    def geostore_password
    def chartscript_name
}
def argsMap = [
    configuration: new Conf(
        geostore_url:      "http://127.0.0.1:9191/geostore/rest",
        geostore_username: "admin",
        geostore_password: "admin",
        chartscript_name:  "deforestation_script"
    )
];
//execute(argsMap)
// Comment out up to here

def execute(Map argsMap)
{
    log.info "Starting chart script"

    GeoStoreClient client = createGeoStore(argsMap);
    UNREDDGeostoreManager manager = new UNREDDGeostoreManager(client)

    chartScriptName = argsMap.get("configuration").getProperties().get("chartscript_name");

    // Load forest change forest data
    forestData = importData(manager, 'forest_mask_stats', true)
    nonForestData = importData(manager, 'forest_mask_stats', false)

    // Load localized data
    loc = loadLangData(langFilePath)

    def engine = new SimpleTemplateEngine()
    def htmlTemplate = engine.createTemplate(new File(htmlTemplateFilePath));
    //def csvTemplate  = engine.createTemplate(new File(csvTemplateFilePath));

    def lastYear  = null;
    def firstYear = null;

    deletePreviousChartData(client, chartScriptName);

    // Iterate through the languages
    loc.each { langKey, loc ->
        // Create one HTML per row in the forest change stats data
        forestData.each() { featureId, row ->
            try {
                def years = row.keySet();
                if (lastYear  == null) lastYear  = years.max()
                if (firstYear == null) firstYear = years.min()

                def binding = ['loc': loc, 'forest': row, 'nonForest': nonForestData[featureId], 'lastYear': lastYear, 'firstYear': firstYear]
                html = htmlTemplate.make(binding)

                // DEBUG: Save as file
                //polygonId = deforestationValues[0] as int;
                //outputFilePath = outputBaseDir + '/' + langKey + '/' + prefix + '/' + prefix + '_' + featureId + '.html'
                //saveAsFile(html, outputFilePath)
                //saveAsFile(html, '/Users/sgiaccio/stats/' + featureId + '.html') // DEBUG

                // Save in GeoStore
                def resourceName = chartScriptName + "_" + featureId + "_" + langKey
                id = saveOnGeoStore(client, featureId, resourceName, html.toString(), "deforestation_script", false, langKey, "html")
                log.info "GeoStore resource saved: Resource Name = " + resourceName + " - ID = " + id
            } catch (Exception e) {
                log.info("Problem encountered in creating chart for featureId = " + featureId)
                e.printStackTrace();
            }
        }

        // Create csv
        //def csvBinding = ['loc': loc, 'forestChange': forestChangeStatsData]
        //def csv = csvTemplate.make(csvBinding)
        //println csv; // DEBUG
    }

    return ["return": []]
}

def loadLangData(langFilePath)
{
    langFile = new File(langFilePath)
    lines = langFile.readLines()
    headerLine = lines.head().split("\t")
    languages = headerLine.tail() // remove first column from first line (it's not a language code nor a label id)

    // fill the loc hash map
    loc = [:]
    lines = lines.tail()
    lines.each { row ->
        splitRow = row.split("\t")
        key = splitRow.head()
        splitRow = splitRow.tail()
        splitRow.eachWithIndex { column, i ->
            values = loc[languages[i]]
            if (values == null) {
                loc[languages[i]] = [:]
                loc[languages[i]][key] = column
            } else {
                values[key] = column //.strip()
            }
        }
    }

    return loc
}

def deletePreviousChartData(client, chartScriptName) {
    UNREDDGeostoreManager manager = new UNREDDGeostoreManager(client)

    // Search all chart data for the given chart script
    List data = manager.searchChartDataByChartScript(chartScriptName)

    // Delete the chart data found
    for (chartData in data)
    {
        def id = chartData.getId();
        log.info("Resource deleted - id = " + id)

        client.deleteResource(id);
    }
}

def saveOnGeoStore(client, featureId, name, html, chartScriptName, published, language, format)
{
    // Create the UNREDDChartData object and fill the atributes
    unreddChartData = new UNREDDChartData()
    unreddChartData.setAttribute(UNREDDChartData.Attributes.CHARTSCRIPT, chartScriptName)
    unreddChartData.setAttribute(UNREDDChartData.Attributes.PUBLISHED, published ? "true" : "false")
    unreddChartData.setAttribute(UNREDDChartData.Attributes.FEATUREID, featureId + "")

    // These attributes are not used yet
    //unreddChartData.setAttribute(UNREDDChartData.Attributes.LANGUAGE, language)
    //unreddChartData.setAttribute(UNREDDChartData.Attributes.FORMAT, format)

    // Create the RESTResource and set the name
    RESTResource chartDataRestResource = unreddChartData.createRESTResource()
    chartDataRestResource.setName(name)

    // Set the data to be stored
    RESTStoredData rsd = new RESTStoredData()
    rsd.setData(html)
    chartDataRestResource.setStore(rsd)

    // Insert in GeoStore
    int id = client.insert(chartDataRestResource)
    return id
}

// Loads the stats data from GeoStore
def importData(manager, dataId, forest)
{
    List resources = manager.searchStatsDataByStatsDef2(dataId); // dataId)

    Map output = new HashMap()

    for (Resource resource : resources)
    {
        data = resource.getData()

        int year  = (Float.parseFloat(getAttribute(resource.getAttribute(), UNREDDStatsData.Attributes.YEAR).getValue())).trunc()
        def lines = parseTable(data.getData(), forest)
        lines.each { id, line ->
            temp = output[id]
            if (temp == null) {
                output[id] = new TreeMap()
                output[id][year] = line
            } else {
                temp[year] = line
            }
        }
    }

    return output
}


def fillNullRows(map) {
    print " ----- " + map.get(map.keySet().min());
    return null;
}

// Parses a CSV table - returns a HashMap where the key is the polygon ID (first column in the CSV)
// and the value is the full parsed row (stored as an array)
def parseTable(table, forest)
{
    HashMap lines = new HashMap()

    table.eachLine { line ->
        parsedArr = []
        arr = line.tokenize(csvSeparator)

        if ("0".equals(arr[1]) && forest || "1".equals(arr[1]) && !forest)
            return false // skip loop

        polygonId = Integer.parseInt(arr[0])

        // Values for each administrative regions are split in two rows (forest and non-forest) - join them together again
        for (i in 2..<arr.size) // first element in array is the polygon id, don't need it
        {
            //println 'i = ' + i
            //println 'Double.parseDouble(arr[i]) = ' + Double.parseDouble(arr[i])
            //println 'parsedArr[i - 2] = ' + parsedArr[i - 2]
            parsedArr[i - 2] = Double.parseDouble(arr[i])
        }

        //println 'parsedArr = ' + parsedArr
        lines.put(polygonId, parsedArr)
    }

    //print lines
    return lines
}

def getAttribute(List attributeList, attribute)
{
    for (Attribute attr : attributeList) {
        if (attr.getName().equals(attribute.getName())) {
            return attr
        }
    }

    return null
}

def saveAsFile(html, outputFilePath)
{
    log.info("Saving output to file: " + outputFilePath);
    out = new File(outputFilePath)
    out.write(html.toString(), "UTF-8")
}

GeoStoreClient createGeoStore(Map argsMap) {
    Map props = argsMap.get("configuration").getProperties();

    log.info("geostore url: " + props.get("geostore_url"));

    String gurl  = props.get("geostore_url");
    String guser = props.get("geostore_username");
    String gpw   = props.get("geostore_password");

    GeoStoreClient client = new GeoStoreClient();
    client.setGeostoreRestUrl(gurl);
    client.setUsername(guser);
    client.setPassword(gpw);
    return client;
}
deforestation_chart_template.html, the html template used by the groovy script. For example:
<!DOCTYPE HTML PUBLIC "-//W3C//DTD HTML 4.01//EN" "http://www.w3.org/TR/html4/strict.dtd">
<html>
  <head>
    <meta http-equiv="Content-Type" content="text/html; charset=utf-8">
    <title>Chart</title>

    <script type="text/javascript" src="http://ajax.googleapis.com/ajax/libs/jquery/1.4.2/jquery.min.js"></script>
    <script type="text/javascript" src="/portal/js/highcharts/highcharts.js"></script>

    <script type="text/javascript">
      var gup = function (name) {
        name = name.replace(/[\\[]/,"\\\\\\[").replace(/[\\]]/,"\\\\\\]");
        var regexS = "[\\?&]"+name+"=([^&#]*)";
        var regex = new RegExp( regexS );
        var results = regex.exec( window.location.href );
        if (results == null)
          return "";
        else
          return decodeURIComponent(results[1]);
      }

      \$(document).ready(function() {
        var colors = Highcharts.getOptions().colors;

        var fccColors = {
          atlanticForest: "#005700",
          chacoWoodlands: "#01E038",
          nonForest: "#FFFF9C",
          water: "#3938FE"
        };

        \$('#title').text(gup('name').toLowerCase());

        chart1 = new Highcharts.Chart({
          chart: {
            renderTo: 'container1',
            defaultSeriesType: 'line'
          },
          title: {
            text: '<%=  loc["deforestation"] %>',
            x: -20 //center
          },
          subtitle: {
            text: '<%= firstYear + "-" + lastYear %>',
            x: -20
          },
          xAxis: {
            categories: [
              <% forest.keySet().eachWithIndex { year, i -> %>
              '<%= year  %>'
              <%   if (i + 1 < forest.size()) print ',' %>
              <% } %>
            ],
            labels: {
              rotation: -45,
              align: 'right',
              style: {
                font: 'normal 10px Verdana, sans-serif'
              }
            }
          },
          yAxis: {
            title: {
              text: '<%= loc["area"] %> (Km<sup>2</sup>)'
            },
            plotLines: [{
              value: 0,
              width: 1,
              color: '#808080'
            }]
          },
          tooltip: {
            formatter: function() {
              return this.x +': '+ this.y.toFixed(0) +' Km<sup>2</sup>';
            }
          },
          legend: {
            enabled: false,
            layout: 'vertical',
            align: 'right',
            verticalAlign: 'top',
            x: -10,
            y: 100,
            borderWidth: 0
          },
          series: [{
            name: '<%= loc["deforestation"] %>',
            data: [
              <% forest.eachWithIndex() { year, values, i -> %>
              <%=  (values[0]) / 1E6 %>
              <%   if (i + 1 < forest.size()) print ',' %>
              <% } %>
            ],
            color: fccColors.atlanticForest
          }],
          credits: {
            enabled: false
          }
        });

      });
    </script>

    <style type="text/css">
      body
      {
        font: 100% "Trebuchet MS", sans-serif;
        margin: 0;
      }

      #top
      {
        position: relative;
        width: 800px;
      }

      #title
      {
        font-size: 120%;
        width: 700px;
        top: 10px;
        text-align: center;
        position: relative;
        margin: auto;
        text-transform:capitalize;
      }

      #container1
      {
        /*border: 1px dashed grey;*/
        width: 800px;
        height: 400px;
        margin: 0 auto;
        position: absolute;
        left: 0;
        top: 50px;
      }

      .print {
        display:block;
        width: 32px;
        height: 32px;
        float: left;
        /*padding:5px 0 0px 20px;
        color:#8e8e8e;*/
      }

      a img {
        border: none;
      }

      #hover_text,#disclaimer
      {
        width: 800px;
        height: 20px;
        font-size: 80%;
        margin: 0 auto;
        position: absolute;
        text-align: center;
      }

      #hover_text
      {
        top: 480px;
      }

      #disclaimer
      {
        top: 495px;
      }

      @media print {
        #print_link
        {
          display: none;
        }

        #hover_text
        {
          display: none;
        }
      }
    </style>

  </head>
  <body>
    <div id="top">
      <div id="print_link">
        <a href="#print" title="<%= loc.print_this_chart %>" class="print" onClick="window.print();return false;"><img src="http://www.rdc-snsf.org/images/Printer.png"></a>
      </div>
      <div id="title"></div>
    </div>

    <div id="container1"></div>

    <div id="hover_text"><%= loc.hover_text %></div>
  </body>
</html>
lang.csv, contains text strings translated to the different languages. Note this is a TAB separated value file. For example:key es en deforestation Deforestacion Deforestation Primary Primaria Primary area Superficie Area print_this_chart Imprimir esta grafica Print this chart hover_text Situar el raton sobre las graficas para ver los valores Please place the mouse pointer over the charts to see values
In a default configuration, these files are placed in /var/stg_geobatch/config/chartscripts.
See Deploy and configure staging GeoBatch.
Chart script list
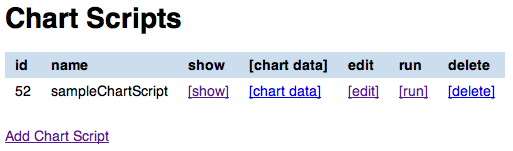
Chart script list
The chart script list page shows all the chart scripts linked to a given stats def. For each chart script you can:
- view the chart script attributes
- edit the chart script attributes
- run a chart script
- delete a chart script
- view the list of related chart data
You can create a new chart script record by clicking on the Add chart script link.
Show chart script attributes
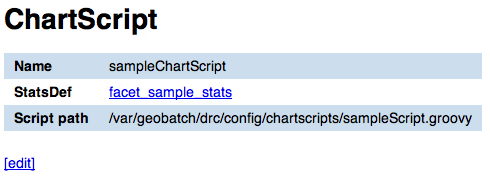
Show chart script
In this page you can view attributes and data for a given chart script record. For attribute definition please refer to Chart script edit/add form.
The page also contains the link to the stats def record a chart script depends on.
Chart script edit/add form
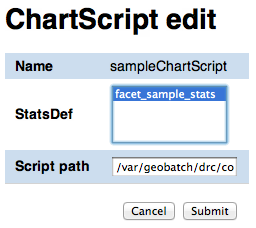
Chart script edit
In the chart script edit/add form you can enter the following attribute for a stats def:
- Name
- The name of the chart script (only editable if adding a new chart script, not when editing an existing one)
- StatsDef
- The list of stats defs this chart script depends on
- Script path
- Absolute path of the Groovy script that creates the chart data
Once done with the editing you can click on the Submit button to save the changes, or you can click Cancel at any moment to cancel the editing.
Run a chart script
If the chart script has been modified you can rebuild the charts and by clicking the [run] link.
Delete a chart script
To delete a chart script click on the [delete] link in the chart script list and click Ok on the confirmation dialog. All the related chart data are automatically deleted.
Chart data
Chart data records contain the charts that are generated by the Groovy chart scripts.
Chart data list
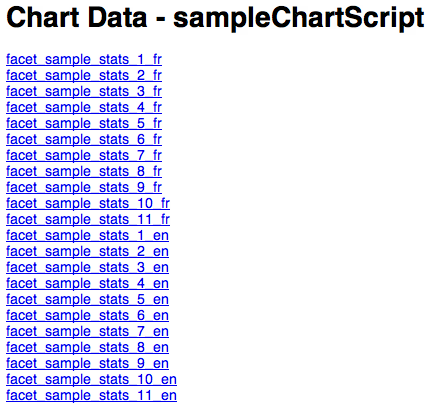
Chart data list
By clicking on the [chart data] link in the chart script list page you get a list of all the charts produced by the script. To preview the chart before publishing you can click on one of the chart data links (see Chart data overview image below).
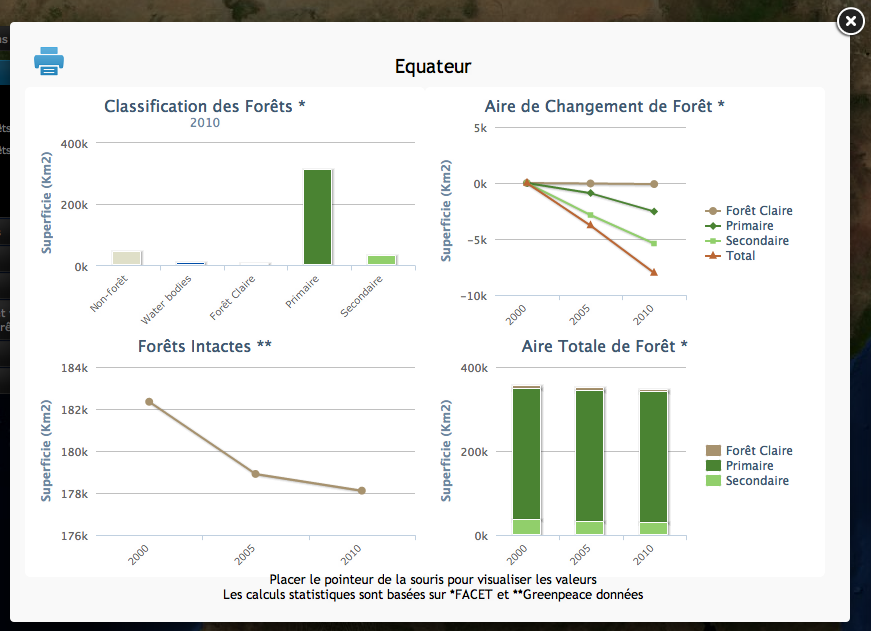
Chart data overview