

Patterns and Hatches
From the Welcome Page navigate to .
Note
You have to be logged in as Administrator in order to activate this function.
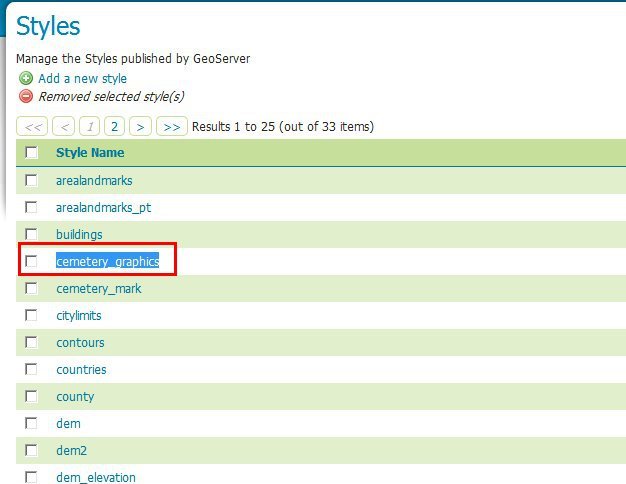
Select “cemetery_graphics” from the list
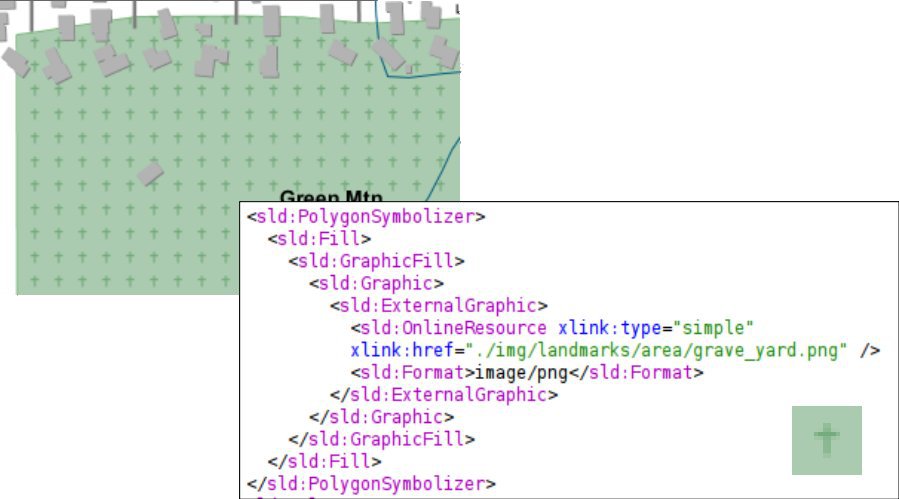
Patterns filling SLD
In the SLD Editor you will see the following XML:
<?xml version="1.0" encoding="UTF-8"?>
    <sld:StyledLayerDescriptor
    xmlns="http://www.opengis.net/sld"
    xmlns:sld="http://www.opengis.net/sld"
    xmlns:ogc="http://www.opengis.net/ogc"
    xmlns:gml="http://www.opengis.net/gml"
    xmlns:xlink="http://www.w3.org/1999/xlink" version="1.0.0">
      <sld:UserLayer>
            <sld:UserStyle>
              <sld:Name>tl 2010 08013 arealm</sld:Name>
              <sld:Title/>
              <sld:FeatureTypeStyle>
                    <sld:Rule>
                      <sld:Name>cemeteries</sld:Name>
                      <ogc:Filter>
                            <ogc:PropertyIsEqualTo>
                              <ogc:PropertyName>MTFCC</ogc:PropertyName>
                              <ogc:Literal>K2582</ogc:Literal>
                            </ogc:PropertyIsEqualTo>
                      </ogc:Filter>
                      <sld:MaxScaleDenominator>500000.0</sld:MaxScaleDenominator>
                      <sld:PolygonSymbolizer>
                            <sld:Fill>
                              <sld:GraphicFill>
                                    <sld:Graphic>
                                      <sld:ExternalGraphic>
                                            <sld:OnlineResource
                                            xlink:type="simple"
                                            xlink:href="./img/landmarks/area/grave_yard.png" />
                                            <sld:Format>image/png</sld:Format>
                                      </sld:ExternalGraphic>
                                    </sld:Graphic>
                              </sld:GraphicFill>
                            </sld:Fill>
                      </sld:PolygonSymbolizer>
                    </sld:Rule>
              </sld:FeatureTypeStyle>
            </sld:UserStyle>
      </sld:UserLayer>
    </sld:StyledLayerDescriptor>
Filling with patterns
Note
The above SLD defines a
<PolygonSymbolizer>with a<GraphicFill>pointing to a png ./img/landmarks/area/grave_yard.png in the geoserver data directory, which will be used by GeoServer as pattern to fill the polygon.Like before, select now “cemetery_mark” from the list

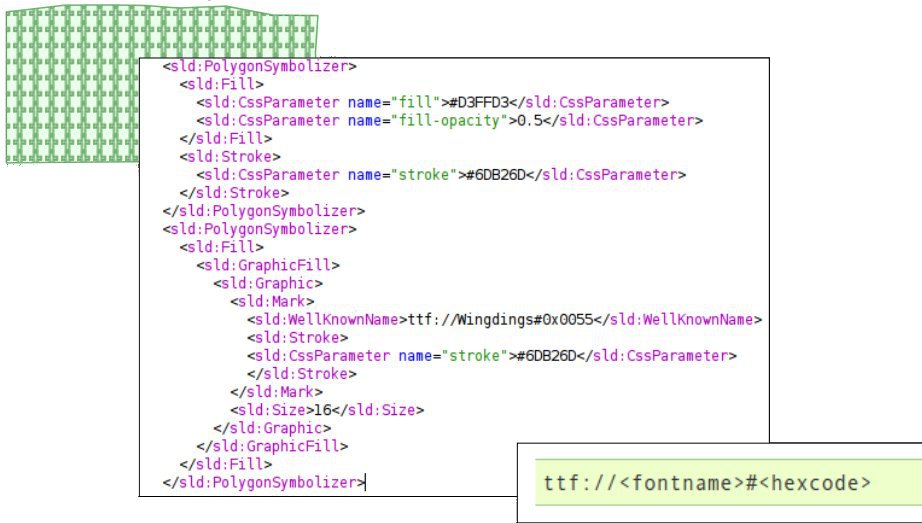
True Type Font filling SLD
In the SLD Editor you will see the following XML:
<?xml version="1.0" encoding="UTF-8"?>
    <sld:StyledLayerDescriptor
    xmlns="http://www.opengis.net/sld"
    xmlns:sld="http://www.opengis.net/sld"
    xmlns:ogc="http://www.opengis.net/ogc"
    xmlns:gml="http://www.opengis.net/gml"
    xmlns:xlink="http://www.w3.org/1999/xlink" version="1.0.0">
      <sld:UserLayer>
            <sld:Name>cemeteries</sld:Name>
            <sld:UserStyle>
              <sld:Name>tl 2010 08013 arealm</sld:Name>
              <sld:Title/>
              <sld:FeatureTypeStyle>
                    <sld:Rule>
                      <sld:Name>cemeteries</sld:Name>
                      <ogc:Filter>
                            <ogc:PropertyIsEqualTo>
                              <ogc:PropertyName>MTFCC</ogc:PropertyName>
                              <ogc:Literal>K2582</ogc:Literal>
                            </ogc:PropertyIsEqualTo>
                      </ogc:Filter>
                      <sld:MaxScaleDenominator>500000.0</sld:MaxScaleDenominator>
                      <sld:PolygonSymbolizer>
                            <sld:Fill>
                              <sld:CssParameter name="fill">#D3FFD3</sld:CssParameter>
                              <sld:CssParameter name="fill-opacity">0.5</sld:CssParameter>
                            </sld:Fill>
                            <sld:Stroke>
                              <sld:CssParameter name="stroke">#6DB26D</sld:CssParameter>
                            </sld:Stroke>
                      </sld:PolygonSymbolizer>
                      <sld:PolygonSymbolizer>
                            <sld:Fill>
                              <sld:GraphicFill>
                                    <sld:Graphic>
                                      <sld:Mark>
                                            <sld:WellKnownName>ttf://Wingdings#0x0055</sld:WellKnownName>
                                            <sld:Stroke>
                                            <sld:CssParameter name="stroke">#6DB26D</sld:CssParameter>
                                            </sld:Stroke>
                                      </sld:Mark>
                                      <sld:Size>16</sld:Size>
                                    </sld:Graphic>
                              </sld:GraphicFill>
                            </sld:Fill>
                      </sld:PolygonSymbolizer>
                    </sld:Rule>
              </sld:FeatureTypeStyle>
            </sld:UserStyle>
      </sld:UserLayer>
    </sld:StyledLayerDescriptor>
Filling with TTF fonts
Note
The above SLD defines a
<PolygonSymbolizer>with a<GraphicFill>looking for a specific Windings character ./img/landmarks/area/grave_yard.png in the geoserver data directory, which will be used by GeoServer as pattern to fill the polygon.To see how the styles work, add the cemetery_mark as an alternate style of the layer bplandmarks, and then preview it as done in the previous section:
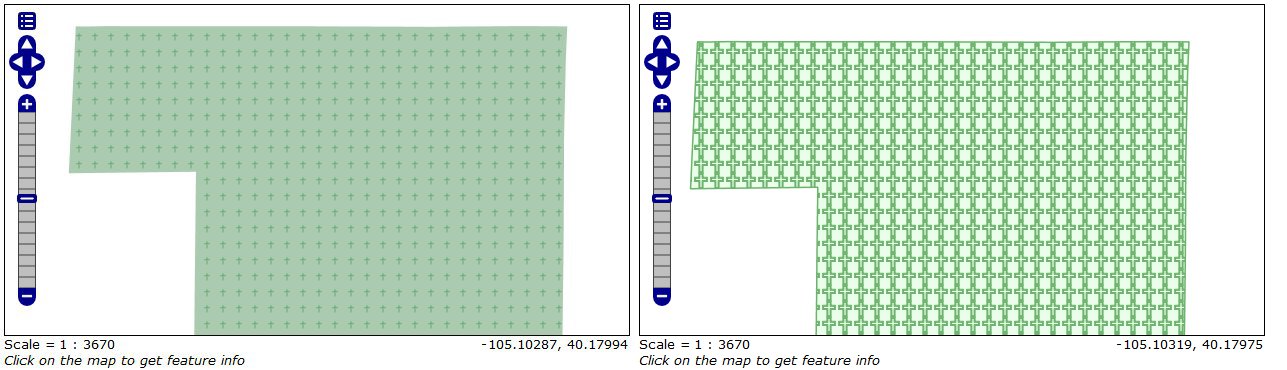
Previewing the bplandmarks layer with the cemetery_graphics and cemetery_mark applied
Lets now take a look at another way to fill poligons using patterns, the Hatches. From the Welcome Page navigate to and select “wetlands” from the list.
Note
You may switch to the second page in order to find the style.
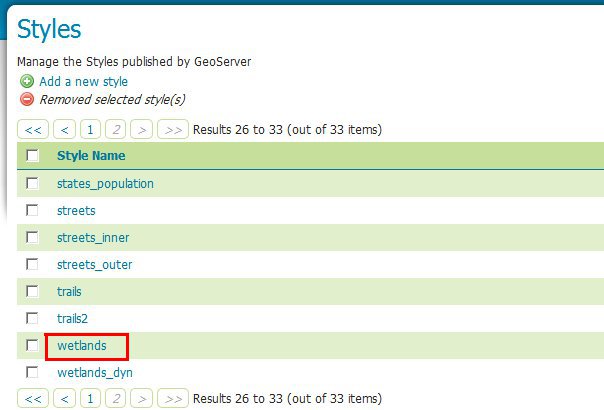
Wetlands style with some hatches
<?xml version="1.0" encoding="UTF-8"?>
    <sld:StyledLayerDescriptor xmlns="http://www.opengis.net/sld" xmlns:sld="http://www.opengis.net/sld" xmlns:ogc="http://www.opengis.net/ogc" xmlns:gml="http://www.opengis.net/gml" version="1.0.0">
      <sld:UserLayer>
            <sld:LayerFeatureConstraints>
              <sld:FeatureTypeConstraint/>
            </sld:LayerFeatureConstraints>
            <sld:UserStyle>
              <sld:Name>Wetlands regulatory area</sld:Name>
              <sld:Title/>
              <sld:FeatureTypeStyle>
                    <sld:Rule>
                      <sld:Name>default rule</sld:Name>
                      <sld:MaxScaleDenominator>10000.0</sld:MaxScaleDenominator>
                      <sld:PolygonSymbolizer>
                            <sld:Fill>
                              <sld:GraphicFill>
                                    <sld:Graphic>
                                      <sld:Mark>
                                            <sld:WellKnownName>shape://times</sld:WellKnownName>
                                            <sld:Fill/>
                                            <sld:Stroke>
                                              <sld:CssParameter name="stroke">#ADD8E6</sld:CssParameter>
                                              <sld:CssParameter name="stroke-width">1.0</sld:CssParameter>
                                            </sld:Stroke>
                                      </sld:Mark>
                                      <sld:Size>
                                            <ogc:Literal>8.0</ogc:Literal>
                                      </sld:Size>
                                    </sld:Graphic>
                              </sld:GraphicFill>
                              <!--
                              <sld:CssParameter name="fill">#7CE3F8</sld:CssParameter>
                              <sld:CssParameter name="fill-opacity">0.5</sld:CssParameter>
                              -->
                            </sld:Fill>
                      </sld:PolygonSymbolizer>
                    </sld:Rule>
              </sld:FeatureTypeStyle>
            </sld:UserStyle>
      </sld:UserLayer>
    </sld:StyledLayerDescriptor>
Comment out the following line in order to see the polygons at lower zoom levels too:
<!-- sld:MaxScaleDenominator>10000.0</sld:MaxScaleDenominator -->Click Submit to add the new SLD.
To see how the styles work, make sure the default style of the Wetlands_regulatory_area feature type is set to wetlands.

Changing the default style of the Wetlands_regulatory_area feature type to wetlands
Use the Map Preview to preview the new style.
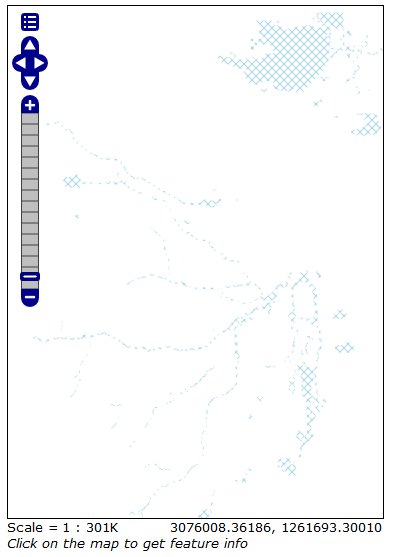
Previewing the bplandmarks layer with the hatches applied
On the previous example we used times as hatches mark. GeoServer makes available different kinds of hatches marks:
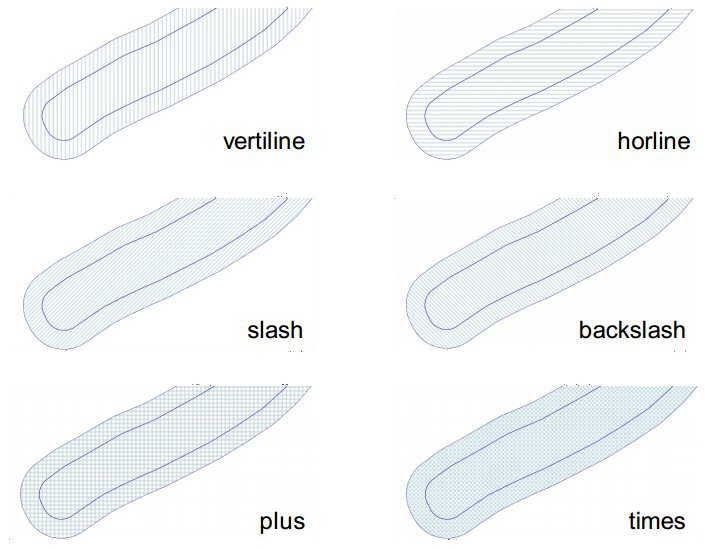
Different types of hatches marks.
Restore the default style of the bplandmarks feature type to arealandmarks.

Changing the default style of the bplandmarks feature type to arealandmarks
Dashes
Lets now familiarize a bit with Dashes. We are going to see how it’s possible to draw several kind of dashes to represent different types of trails or roads.
From the Welcome Page navigate to .
Note
You have to be logged in as Administrator in order to activate this function.
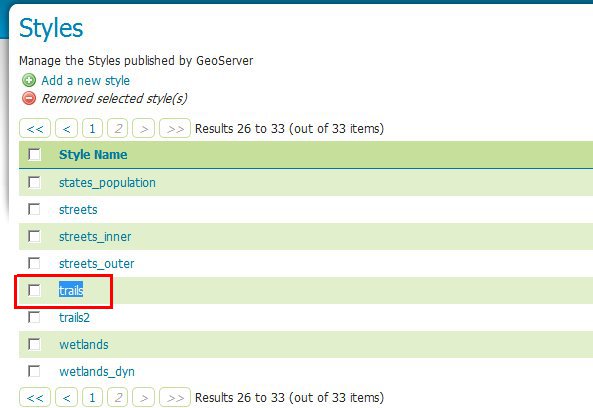
Select “trails” from the list
Dashes SLD
In the SLD Editor you will see the following XML:
<?xml version="1.0" encoding="UTF-8"?>
    <sld:StyledLayerDescriptor xmlns="http://www.opengis.net/sld" xmlns:sld="http://www.opengis.net/sld" xmlns:ogc="http://www.opengis.net/ogc" xmlns:gml="http://www.opengis.net/gml" version="1.0.0">
      <sld:UserLayer>
            <sld:LayerFeatureConstraints>
              <sld:FeatureTypeConstraint/>
            </sld:LayerFeatureConstraints>
            <sld:UserStyle>
              <sld:Name>Trails</sld:Name>
              <sld:Title/>
              <sld:FeatureTypeStyle>
                    <sld:Rule>
                      <sld:MaxScaleDenominator>75000</sld:MaxScaleDenominator>
                      <sld:LineSymbolizer>
                            <sld:Stroke>
                              <sld:CssParameter name="stroke">#6B4900</sld:CssParameter>
                              <sld:CssParameter name="stroke-width">0.1</sld:CssParameter>
                              <sld:CssParameter name="stroke-dasharray">2.0 </sld:CssParameter>
                            </sld:Stroke>
                      </sld:LineSymbolizer>
                    </sld:Rule>
              </sld:FeatureTypeStyle>
            </sld:UserStyle>
      </sld:UserLayer>
    </sld:StyledLayerDescriptor>
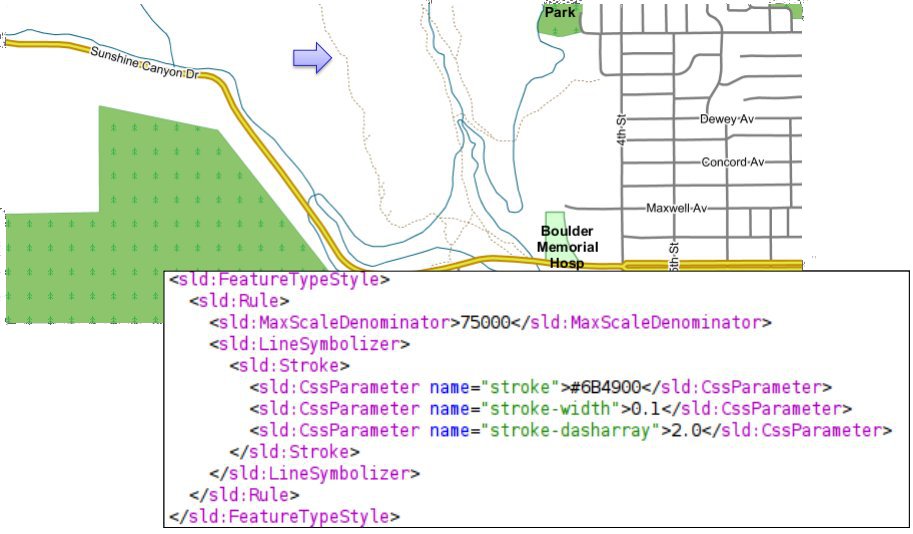
Simple dash-array
Note
The above SLD defines a
<LineSymbolizer>with a<Stroke>using the CSS property stroke-dasharray to represent the trails like a simle gray dash.Note
Encodes a dash pattern as a series of numbers separated by spaces. Odd-indexed numbers (first, third, etc) determine the length in pxiels to draw the line, and even-indexed numbers (second, fourth, etc) determine the length in pixels to blank out the line. Default is an unbroken line. Starting from version 2.1 dash arrays can be combined with graphic strokes to generate complex line styles with alternating symbols or a mix of lines and symbols.
The Style above is the default one for the layer geosolutions:Trails. Lets have a look at a bit more complex example. From the Welcome Page navigate to and select “trails2” from the list
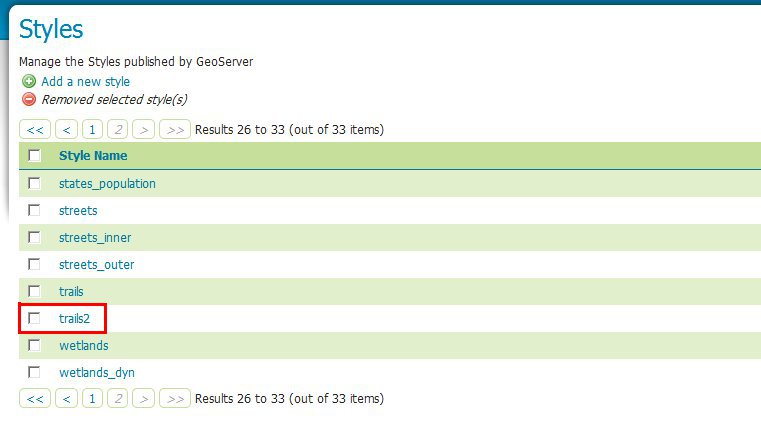
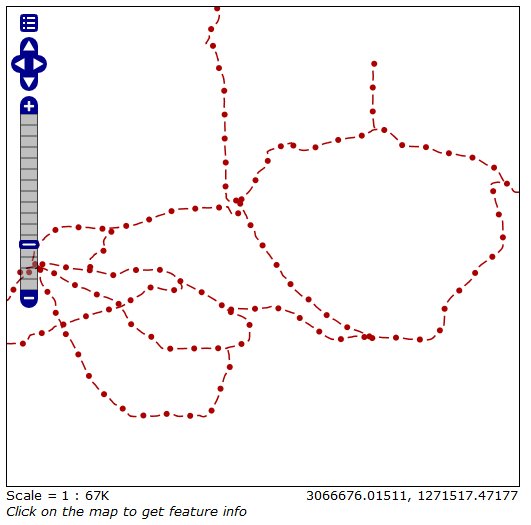
Trails2 Style
In the SLD Editor you will see the following XML:
<?xml version="1.0" encoding="UTF-8"?>
    <sld:StyledLayerDescriptor xmlns="http://www.opengis.net/sld" xmlns:sld="http://www.opengis.net/sld" xmlns:ogc="http://www.opengis.net/ogc" xmlns:gml="http://www.opengis.net/gml" version="1.0.0">
      <sld:UserLayer>
            <sld:LayerFeatureConstraints>
              <sld:FeatureTypeConstraint/>
            </sld:LayerFeatureConstraints>
            <sld:UserStyle>
              <sld:Name>Trails</sld:Name>
              <sld:Title/>
              <sld:FeatureTypeStyle>
                    <sld:Rule>
                      <sld:MaxScaleDenominator>75000</sld:MaxScaleDenominator>
                      <sld:LineSymbolizer>
                            <sld:Stroke>
                              <sld:GraphicStroke>
                                    <sld:Graphic>
                                      <sld:Mark>
                                            <sld:WellKnownName>circle</sld:WellKnownName>
                                            <sld:Fill>
                                              <sld:CssParameter name="fill">#AA0000</sld:CssParameter>
                                            </sld:Fill>
                                      </sld:Mark>
                                      <sld:Size>
                                            <ogc:Literal>6</ogc:Literal>
                                      </sld:Size>
                                    </sld:Graphic>
                              </sld:GraphicStroke>
                              <sld:CssParameter name="stroke-dasharray">6 18</sld:CssParameter>
                            </sld:Stroke>
                      </sld:LineSymbolizer>
                      <sld:LineSymbolizer>
                            <sld:Stroke>
                              <sld:CssParameter name="stroke">#AA0000</sld:CssParameter>
                              <sld:CssParameter name="stroke-dasharray">10 14</sld:CssParameter>
                              <sld:CssParameter name="stroke-dashoffset">14</sld:CssParameter>
                            </sld:Stroke>
                      </sld:LineSymbolizer>
                    </sld:Rule>
              </sld:FeatureTypeStyle>
            </sld:UserStyle>
      </sld:UserLayer>
    </sld:StyledLayerDescriptor>

Railroad dash-array
Note
We may notice two interesting things in this style, two
<LineSymbolizer>the first one defininig a circle Mark with a simple dasharray and the second one a simple stroke defining also a dashoffset. The latter specifies the distance in pixels into the dasharray pattern at which to start drawing. Default is 0.Open the geosolutions:Trails layers and add trails2 as an additional style, then go to the Layer Preview to see it in action
Warning
You have to zoom in from the layer preview in order to see the lines due to the MaxScaleDenominator