

Training Machine Simplified Architecture
The UNREDD NMFS platform provides both a staging and a dissemination areas, so the data can be reviewed and prior to its definite publication.
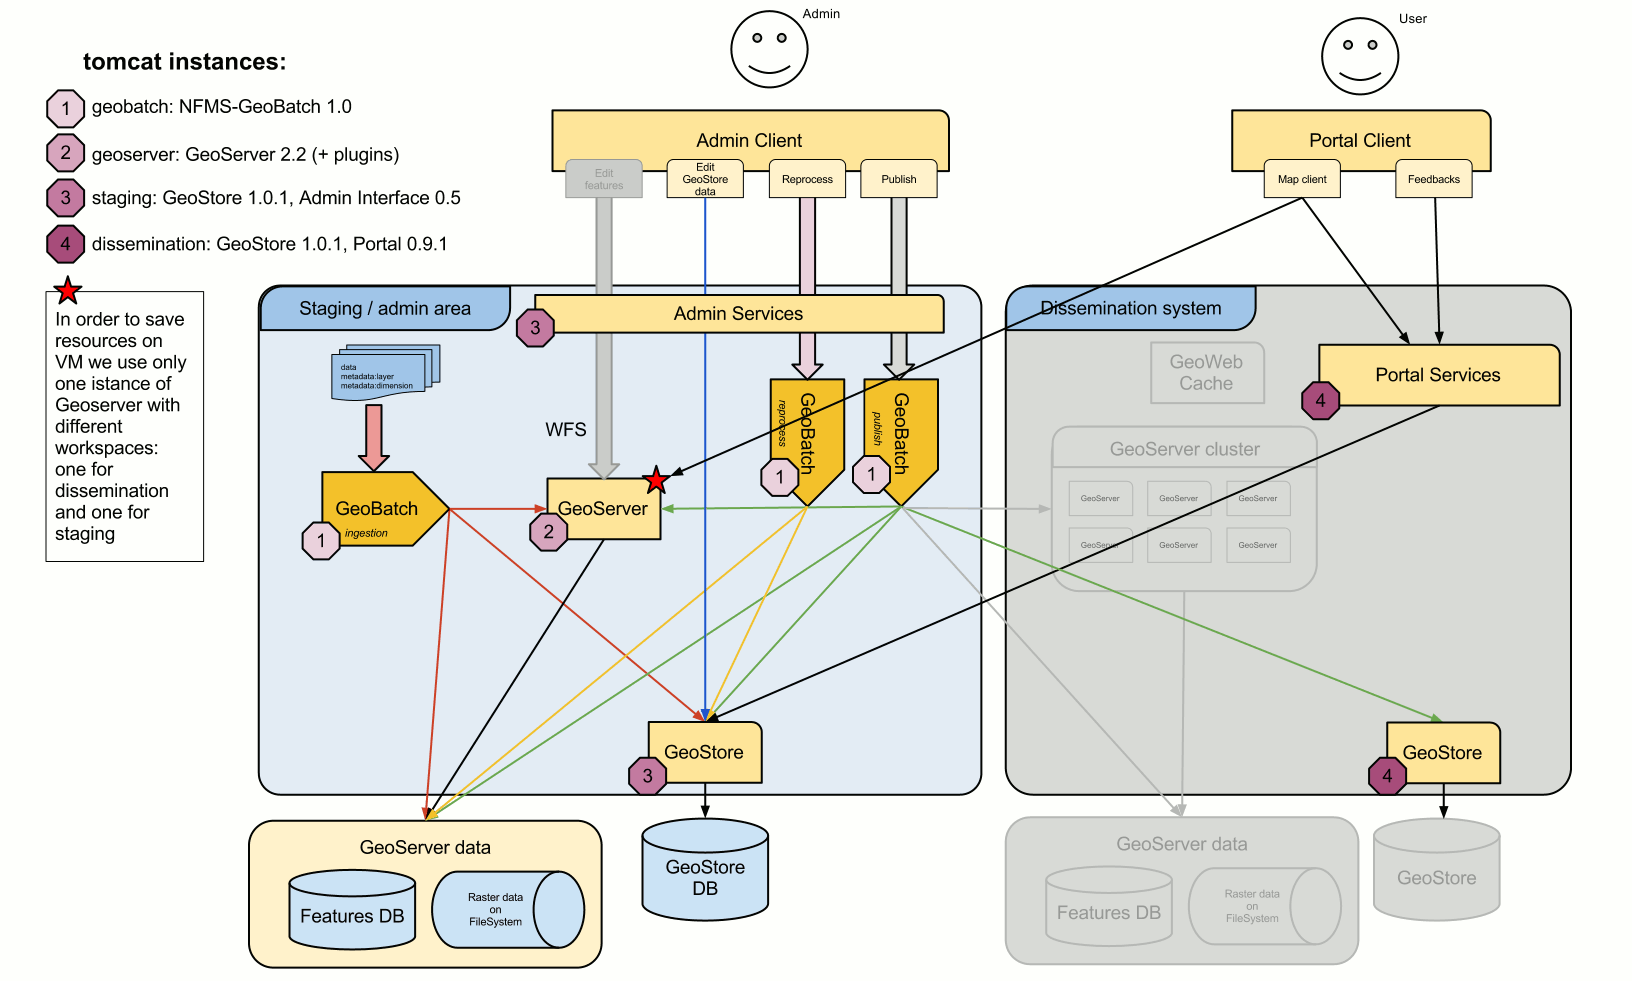
LiveDVD simplified architecture
components not present in the Training machine have been grayed out in the figure. Mainly, the dissemination block has been removed. This simplified version contains all the building blocks needed to fully understand the platform, while reducing the complexities needed only in real production environments.
In this case, both staging and dissemination areas share the same geoserver instance, so the publishing flow, is copying the data from the staging workspace to tne dissemination one in the same machine.
Tomcat instances
All of the UNREDD NFMS applications run on Apache Tomcat. They are split into multiple Tomcat instances, so they can be run separately. In the LiveDVD, you will find four Tomcat instances:
| Instance name | HTTP | AJP | Instance location |
|---|---|---|---|
| staging | 8200 | 8100 | /var/tomcat/staging |
| geoserver | 8201 | 8101 | /var/tomcat/geoserver |
| geobatch | 8202 | 8102 | /var/tomcat/geobatch |
| dissemination | 8203 | 8103 | /var/tomcat/dissemination |
These are the web applications contained in each instance:
| Tomcat instance | Contained applications | Configuration dir | Access URL |
|---|---|---|---|
| staging | stg_geostore
admin
|
/var/geostore/stg_config
[not needed]
|
|
| geoserver | geoserver
|
/var/geoserver
|
|
| geobatch | geobatch
|
/var/geobatch
|
|
| dissemination | diss_geostore
portal
|
/var/geostore/diss_config
/var/portal
|
Sample data
Sample data is accessible from a Desktop shorcut to /var/sample_data/[xxx], where [xxx]
is a specific country name.
A sample data bundle will usually include:
- vector: Static vector shapefiles to be published in GeoServer.
- raster: Static raster files to be published in GeoServer.
- mosaic: Properties files needed by GeoServer to create a time-dependant raster mosaic.
- styles: SLD styles for all published data.
- ingest: Sample ingestable zip files.
- stats: Additional data used in statistics computation, such as area per pixel or rasterized provinces.
- chartscripts: Sample groovy scripts, html templates and translation strings to build charts from statistical data.