

Interface description
The NFMS portal page is composed of the following main user interface elements:
- Map
- Allows to overlay, browse and query all the layers available in the portal
- Navigation Buttons
- Used to browse the map (zoom in and out, and zoom to maximum extent)
- Layers Pane
- Used to show or hide layers on the map, and to access layers legend and general information
- Time Slider
- In case of time dependent layers, it allows to select a time instance
- Language Selection Buttons
- When multiple language are supported they allow to select different languages
- Legend Pane
- Shows the legend for the visible layers, together with the link to their source
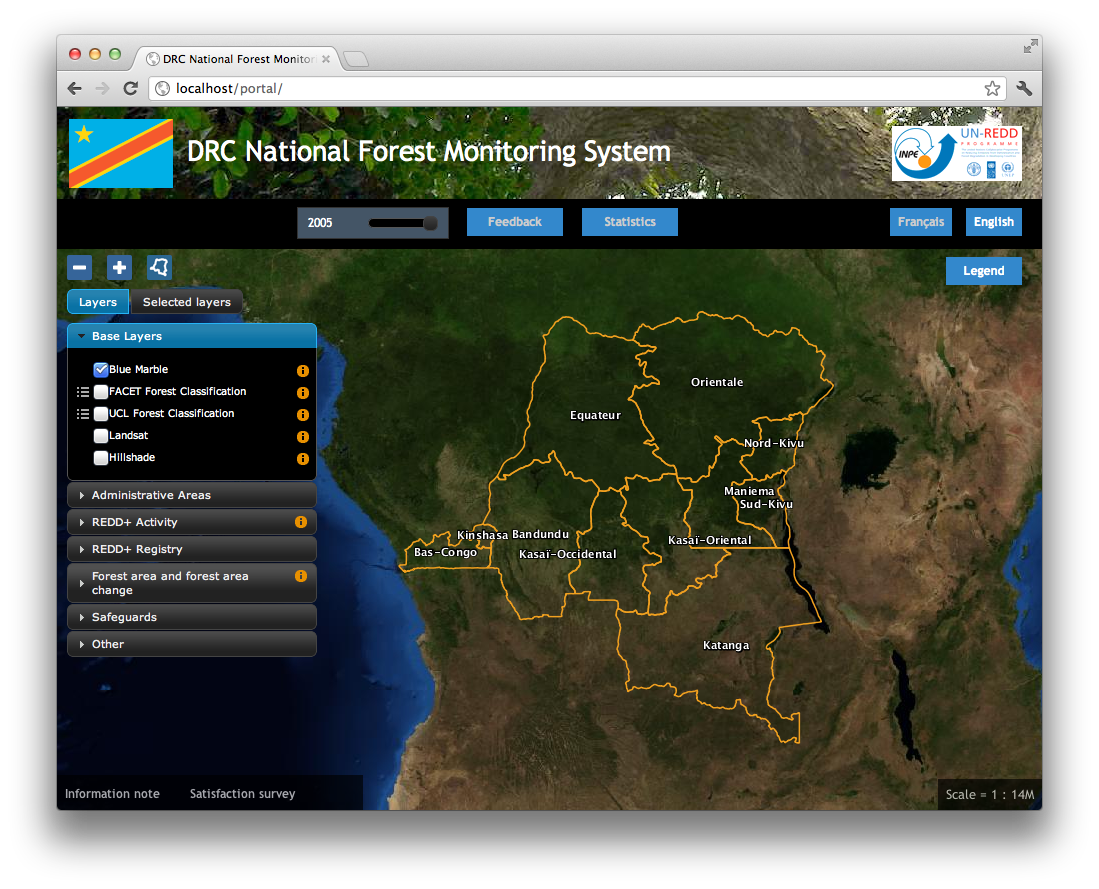
NFMS portal
Follows a detailed description of the user interface elements and functions described above.
Map
The map is the main component of the web portal, it allows the user to overlay and query all the informative layers available in the web portal. The map extent and zoom level can be dynamically adjusted allowing the user to focus on a particular area of interest. It also allows to access statistics for specific polygons and layers.
Navigation Buttons
Navigation buttons are used to zoom in and out and to the maximum extent (the whole country). Zoom levels are discontinuous, an match Google Maps™ ones to allow overlay with their layers if needed. When the map is zoomed on a small area and you want to quickly move to another one, you can zoom to the maximum extent and then zoom in again to the area you are interested in.

Navigation buttons
Layers Pane
The layers pane shows all the map layers available in the portal, organized in a three-levels structure. The first level it’s thematic areas which the layers belongs to. On the example below they are:
- Base layers
- Administrative areas
- REDD+ activity
- Forest area and forest area change
- Safeguards
- Other
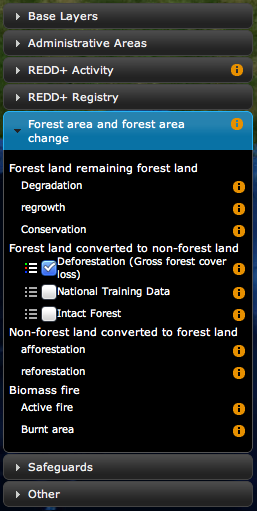
Layers pane
Clicking on one of these headers expands the corresponding pane and shows the layers in that thematic area (Forest Area and Forest Area Change in the figure above).
Layers can eventually be grouped in a second-level sub-category. On the given example, in the Forest area and forest area change thematic area, layers are grouped in the following sub-categories:
- Forest land remaining forest land
- Forest land converted to non-forest land
- Non-forest land converted to forest-land
- Biomass fire
Finally at the third level (or second if not in a subcategory) are the map layers.
For each layer the following features are buttons/icons available:
Showing Layers
If the layer is actually available as an online map (it could not be available as GIS data but the administrator might want the label to be there), a checkbox is shown at its left to add it to the map. Clicking on the checkbox adds the layer to the map and its legend to the Legend Pane <legend-pane> if available. If present, the inline legend button is activated.
Inline Legends
When the layer has one only category (in the case of country boundary layers for instance), an inline legend icon is shown at the left of its label in the layers pane.

Inline legend
Inline Legend Buttons
If the layer has a more complex legend, a “show legend” button is shown instead. When the layer is not active the icon is grayed-out and not active as a button. When the layer is added to the map, the inline legend button is activated and by clicking on it the Legend Pane <legend-pane> is shown and its content automatically scrolls to the legend requested.

Inline legend button
Layer info button
If layer information is available, an info button is shown at the right of the layer label. When you click on it, a modal dialog appears with a description of the layer, which may contain the following information:
- Layer description
- Original data source
- Logos of the organizations providing the data
- Any other relevant information

Layer info dialog
Selected Layers Pane
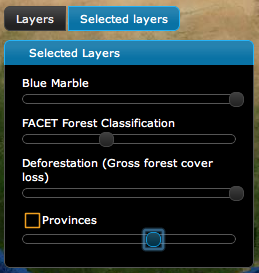
Selected layers pane
Clicking on the Selected layers button you get a subset of the layer list containing only the ones that are currently visible. It’s possible to change the transparency for each layer using the slider under its label.
Time Slider
Some of the layers, in particular the ones that are periodically produced by, or used in, the analysis process, are time-dependent (layer updates in the GeoStore model). To choose a date among the ones available you can drag the time slider (see figure below). The date that the system chooses for each layer is its closest previous one available for that layer. To better explain this behavior let’s consider a particular case in which we have the following layers and dates:
- Deforestation - years 2000, 2005, and 2010
- Landsat mosaic - years 2000 and 2010.
If you select 2005 in the time slider, the system will automatically choose Deforestation year 2005 (as it matches the value you selected) and Landsat mosaic year 2000 (the previous year closest to the one you have chosen).

Time slider
Language Selection Buttons
Portal language is selected by clicking on the language buttons. Depending on the country where the portal is implemented, different languages are available.
When you select a language the system remembers it the next times you reload the portal.
- /language_buttons.png
align: center scale: 75 % Language buttons
Legend Pane
The legend is hidden by default. To show it you can either
- click on the legend button on the top of the page
- click on the inline legend button, on the left of the layers that have a legend
The pane shows the legends for the layers that are being shown on the map. When clicking on an inline legend icon related to a layer, the pane automatically scrolls to its legend.
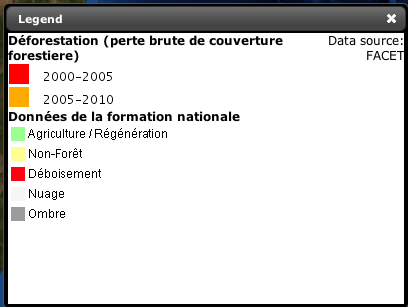
Legend pane
Page Footer
The footer section of the portal contains popups/links to pages with relevant information related to the project in general and could contain links to information specific for the country.

Footer links
The scale of the map is shown at the bottom right of the page.
Browsing the Map
Panning and zooming
Map panning is done by dragging of the mouse pointer over the map itself
Zooming can be done in the following three ways:
- clicking on the zoom in and zoom out buttons on the top-left of the page
- shift-dragging the mouse pointer over the map
- double-clicking on any point on the map
You can also zoom to the maximum extent using the zoom to max extent button, positioned next to the zoom-in button and usually showing a stylized shape of the country.
Querying the map
The Query Dialog
Query Dialog
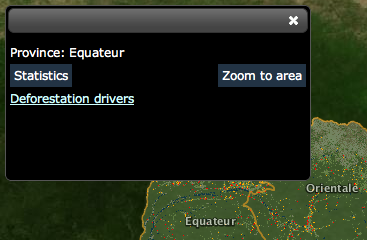
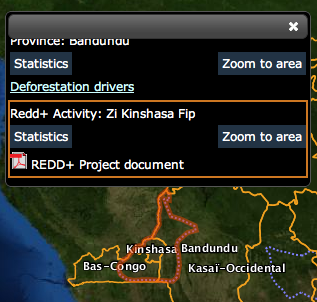
If any queryable layer is visible on the map, you can get access to information and statistics related to them by clicking on the point you are interested to. A dialog is shown with an entry for each queryable layer that has features (if vector) or a no-data value (if raster) on that point. When hovering one of the entries in the dialog, the related polygon feature is highlighted on the map (see image below). You can also zoom to that area by clicking the Zoom to area button, and access statistics based on it.
Query Dialog - feature highlight
Pre-calculated Statistics
By clicking on the statistics button in the query dialog, a modal popup containing the statistics for the area is shown.
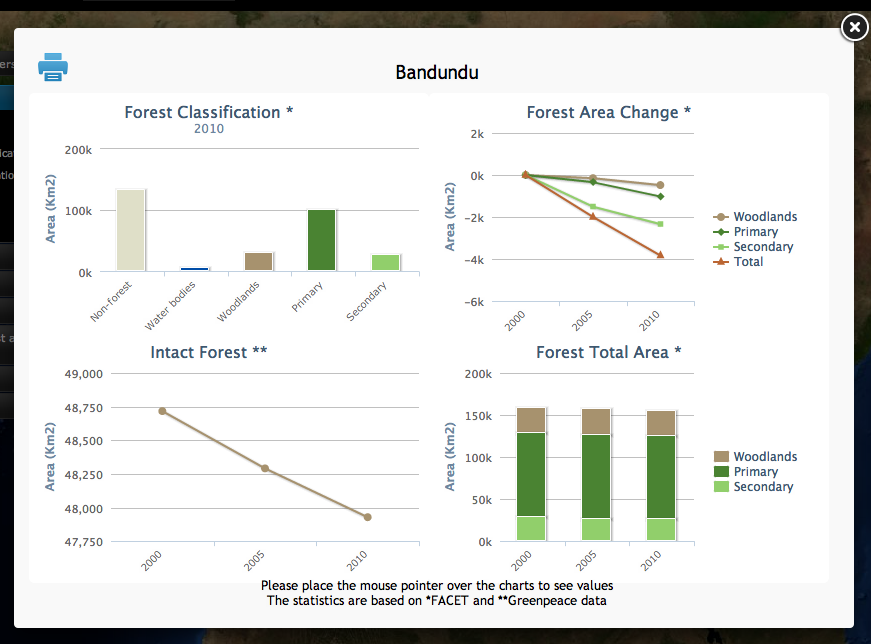
Chart dialog
Hovering the mouse on the chart shows actual values.
The chart can be printed clicking on the printer button on the top left of the dialog.
Real-time Statistics
– To be implemented –
To access real-time statistics:
- click on the Statistics button on the header and start drawing the contour of the area you want to calculate the statistics for (see the image Draw polygon below)
- double click to close the polygon
- a dialog will show you the list of the available statistics
- after you chose the statistic and click on the
Calculatebutton, you’ll have to enter your email and the captcha text and clickOk
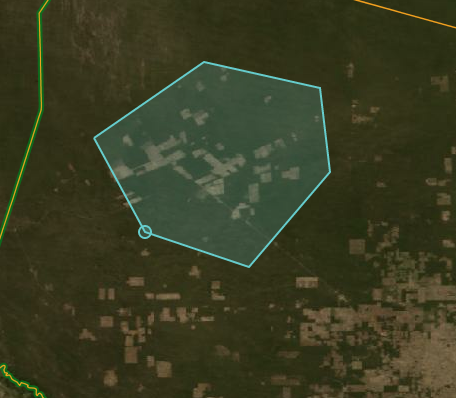
Draw polygon
When the calculation is complete, you will receive by email the URL with the link to the statistics you requested
Feedback
If you want to send comments on the published resources, click on the Feedback button on the header. The feedback dialog will open:
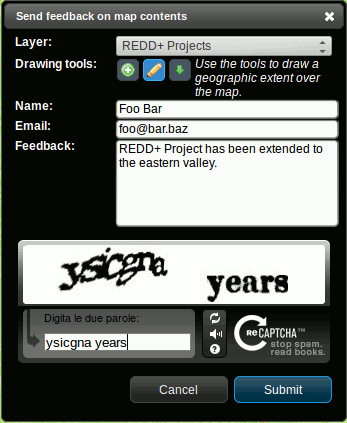
Feedback dialog
- Select the layer you want to give feedback on (for example, REDD+ Projects). To appear in the selector, the layer must be active.
- Use the drawing tools to delimitate the area or areas your comments are refering to. The toolbar offers three different tools:
 Add Polygon to draw new areas on the map.
 Get feature from selected layer to retrieve a geometry from a layer. This tool is only active on queryable vector layers.
 Edit Polygon to change the shape of an area. Drag the nodes to change the shape, or hit del key to delete existing vertices or the entire polygon.
- Write your contact name and email. System administrators may want to contact you for further details on your request.
- Add a feedback message describing your concerns.
- Write the reCAPTCHA words and Submit.
Feedback example
Let’s say that you detect a REDD+ project region that is out of date:
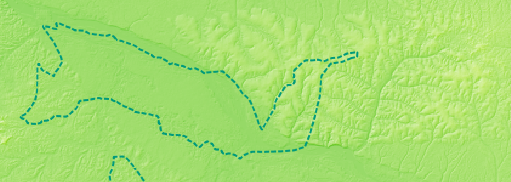
Identify an element worth comenting on the map
First, click on Feedback and select the REDD+ Projects layer. Activate the tool and click inside the region.
The original polygon will be retrieved and presented as an orange, editable geometry:
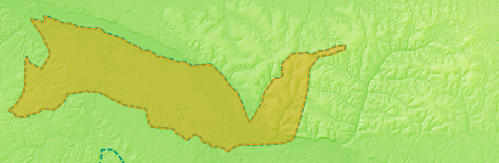
Get an existing element from the layer
Then, select the tool to change its shape draging the nodes:
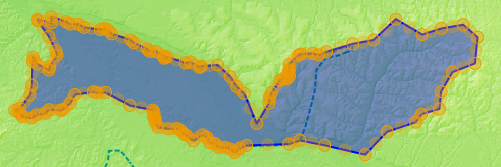
Change its shape
Finally, add a feedback text comment. For example: REDD+ Project has been extended to the eastern valley.