

Charting
This section shows one GeoServer advanced styling characteristic.
- To print dynamic charts over the map add a new style called statespiepss.
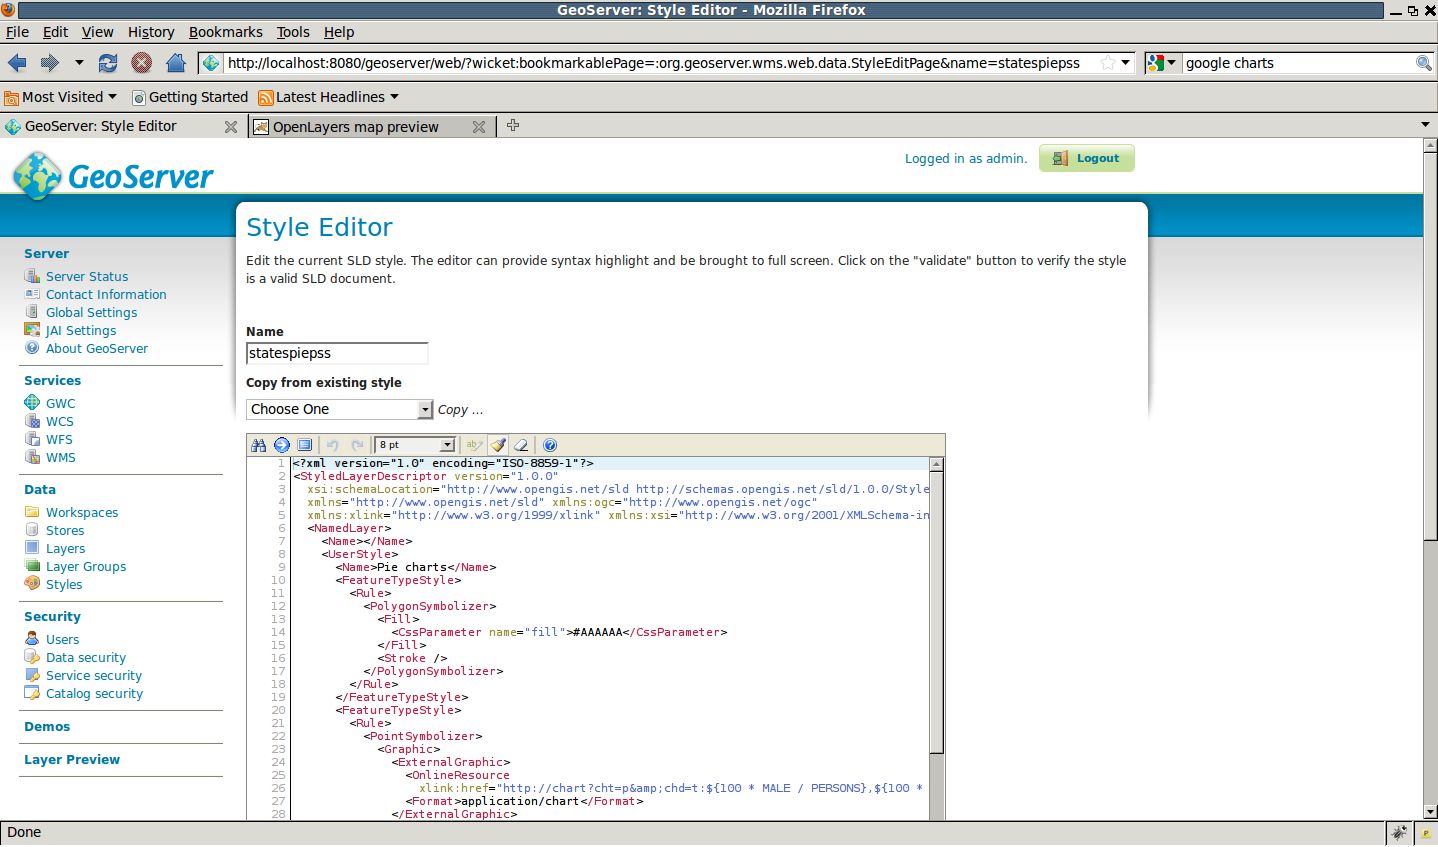
Creating a new Dynamic Style
In the SLD Editor enter the following XML:
<?xml version="1.0" encoding="ISO-8859-1"?> <StyledLayerDescriptor version="1.0.0" xsi:schemaLocation="http://www.opengis.net/sld http://schemas.opengis.net/sld/1.0.0/StyledLayerDescriptor.xsd" xmlns="http://www.opengis.net/sld" xmlns:ogc="http://www.opengis.net/ogc" xmlns:xlink="http://www.w3.org/1999/xlink" xmlns:xsi="http://www.w3.org/2001/XMLSchema-instance"> <NamedLayer> <Name></Name> <UserStyle> <Name>Pie charts</Name> <FeatureTypeStyle> <Rule> <PolygonSymbolizer> <Fill> <CssParameter name="fill">#AAAAAA</CssParameter> </Fill> <Stroke /> </PolygonSymbolizer> </Rule> </FeatureTypeStyle> <FeatureTypeStyle> <Rule> <PointSymbolizer> <Graphic> <ExternalGraphic> <OnlineResource xlink:href="http://chart?cht=p&chd=t:${100 * MALE / PERSONS},${100 * FEMALE / PERSONS}&chf=bg,s,FFFFFF00" /> <Format>application/chart</Format> </ExternalGraphic> <Size> <ogc:Add> <ogc:Literal>20</ogc:Literal> <ogc:Mul> <ogc:Div> <ogc:PropertyName>PERSONS</ogc:PropertyName> <ogc:Literal>20000000.0</ogc:Literal> </ogc:Div> <ogc:Literal>60</ogc:Literal> </ogc:Mul> </ogc:Add> </Size> </Graphic> </PointSymbolizer> </Rule> </FeatureTypeStyle> </UserStyle> </NamedLayer> </StyledLayerDescriptor>
Note
The thing to note is the
<ExternalGraphic>element. We have an expression using the featureType attributes to draw the Pie Chart dynamically. The URL is following the Google Chart API syntax, but the chart is generated internally in GeoServer.Modify the default style of the states layer to the newly created statespiepss.
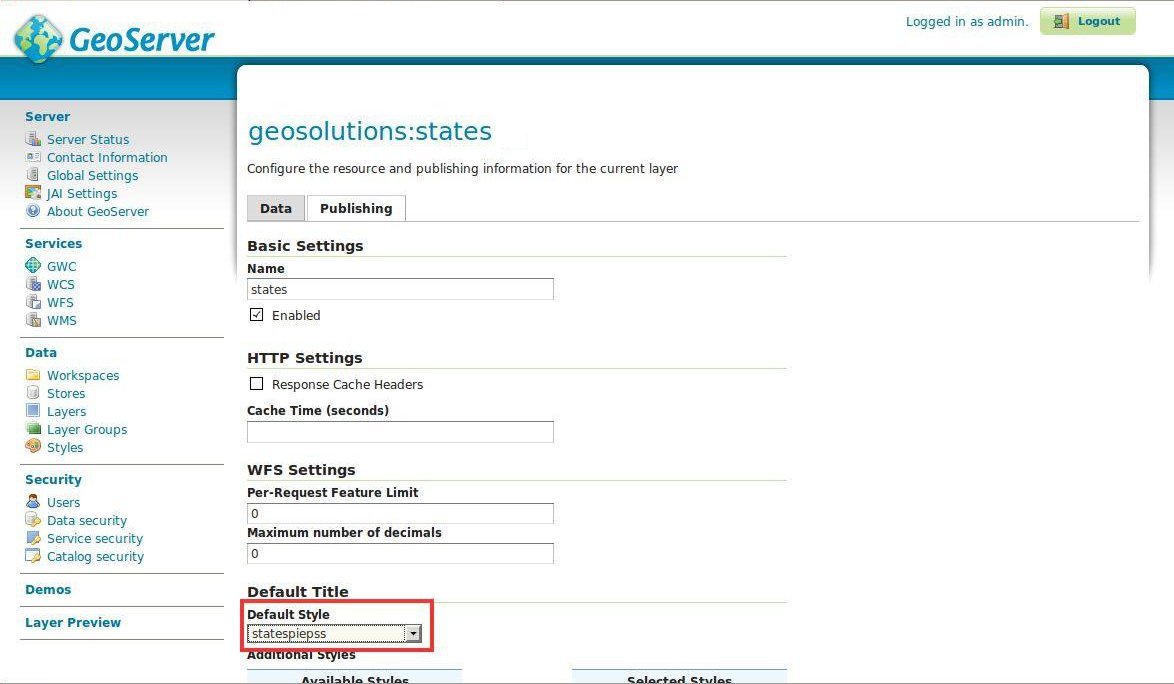
Changing the default style of the states layer
Use the Layer Preview to preview the new style.
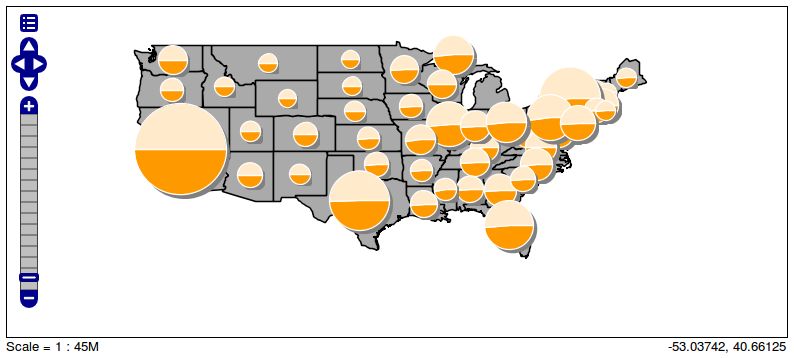
Previewing the states layer with the statespiepss applied
Finally please restore the previous style states.